
I want to create a graphical terminal like a tradingview. For this, I use plotly dash to make the display as comfortable as possible. But a situation arose that I have been unable to resolve for several days now.
Now my code looks like this:
import asyncio import datetime as DT from threading import Thread

import dash import numpy as np import plotly.graph_objs as go from dash import dcc, html from dash.dependencies import Input, Output


# ======================================================================================================================
# === Create DATA ======================================================================================================
# ======================================================================================================================


Start_Time = DT.datetime.timestamp(DT.datetime.now().replace(second=0, microsecond=0)) * 1000 X_time = np.array([]) Y_one = np.array([]) Y_two = np.array([]) Y_three = np.array([])


async def create_connection():
    from random import randrange
    import time
    count = 0
    global X_time
    global Y_one
    global Y_two
    global Y_three

    while count < 1000000:

        X_time = np.append(X_time, count)
        Y_one = np.append(Y_one, randrange(10000))
        Y_two = np.append(Y_two, randrange(10000))
        Y_three = np.append(Y_three, randrange(10000))
        count += 1
        time.sleep(1)


def async_main_wrapper():
    """Not async Wrapper around async_main to run it as target function of Thread"""
    asyncio.run(create_connection())


# ======================================================================================================================
# === Create DASH ======================================================================================================
# ======================================================================================================================

X = np.array([0]) Y = np.array([0])

external_stylesheets = ['https://fonts.googleapis.com/css2?family=Montserrat+Alternates:wght@400;600&display=swap'] app = dash.Dash(__name__, external_stylesheets=external_stylesheets)

colors = {
    'background': '#FDFEFE',
    'text': '#424242' }

app.layout = html.Div(style={'backgroundColor': colors['background']}, children=[
    html.H1(
        children='Main graph',
        style={
            'textAlign': 'left',
            "fontFamily": "Montserrat Alternates",
            "fontWeight": "600",
            'color': colors['text']
        }),
    dcc.Graph(id='live_graph', style={'height': '700px', 'width': '100%'}, animate=True, config={'scrollZoom':True}),
    dcc.Interval(
        id='graph_update',
        interval=1000 * 1
    ), ] )


def create_area(line_Y_one, line_Y_two, line_Y_three, X_time):
    fig = {'data': [line_Y_one, line_Y_two, line_Y_three],
           'layout': go.Layout(xaxis=dict(range=[min(X_time), max(X_time)], rangeslider=dict(visible=True)),
                               yaxis=dict(tickfont=dict(color='rgba(0, 188, 212, 0.0)')),
                               yaxis2=dict(overlaying="y", tickfont=dict(color='rgba(0, 188, 212, 0.0)')),
                               yaxis3=dict(overlaying="y"),
                               )}
    return fig


@app.callback(Output('live_graph', 'figure'),
              Input('graph_update', 'n_intervals')) def update_graph_scatter(graph_update):
    global X_time
    global Y_one
    global Y_two
    global Y_three

    clr_green = 'rgba(139, 195, 74, '
    clr_red = 'rgba(220, 20, 60, '
    clr_brown = 'rgba(93, 64, 55, 1.0)'


    line_Y_one = go.Scatter(
        x=X_time,
        y=Y_one,
        name='Y_one',
        line=dict(color=clr_green + '0.0)'),
        fillcolor=clr_green + '0.3)',
        fill='tozeroy',
        yaxis='y1'
    )
    line_Y_two = go.Scatter(
        x=X_time,
        y=Y_two,
        name='Y_two',
        line=dict(color=clr_red + '0.0)'),
        fillcolor=clr_red + '0.3)',
        fill='tozeroy',
        yaxis='y1'
    )

    line_Y_three = go.Scatter(
        name='Y_three',
        x=X_time,
        y=Y_three,
        line=dict(color=clr_brown),
        yaxis='y3'
    )

    return create_area(line_Y_one, line_Y_two, line_Y_three, X_time)


# ======================================================================================================================
# === Start ===========================================================================================================
# ======================================================================================================================


if __name__ == '__main__':
    th = Thread(target=async_main_wrapper)
    th.start()
    app.run_server(host='localhost', port=8080, debug=True, use_reloader=False)
    th.join()
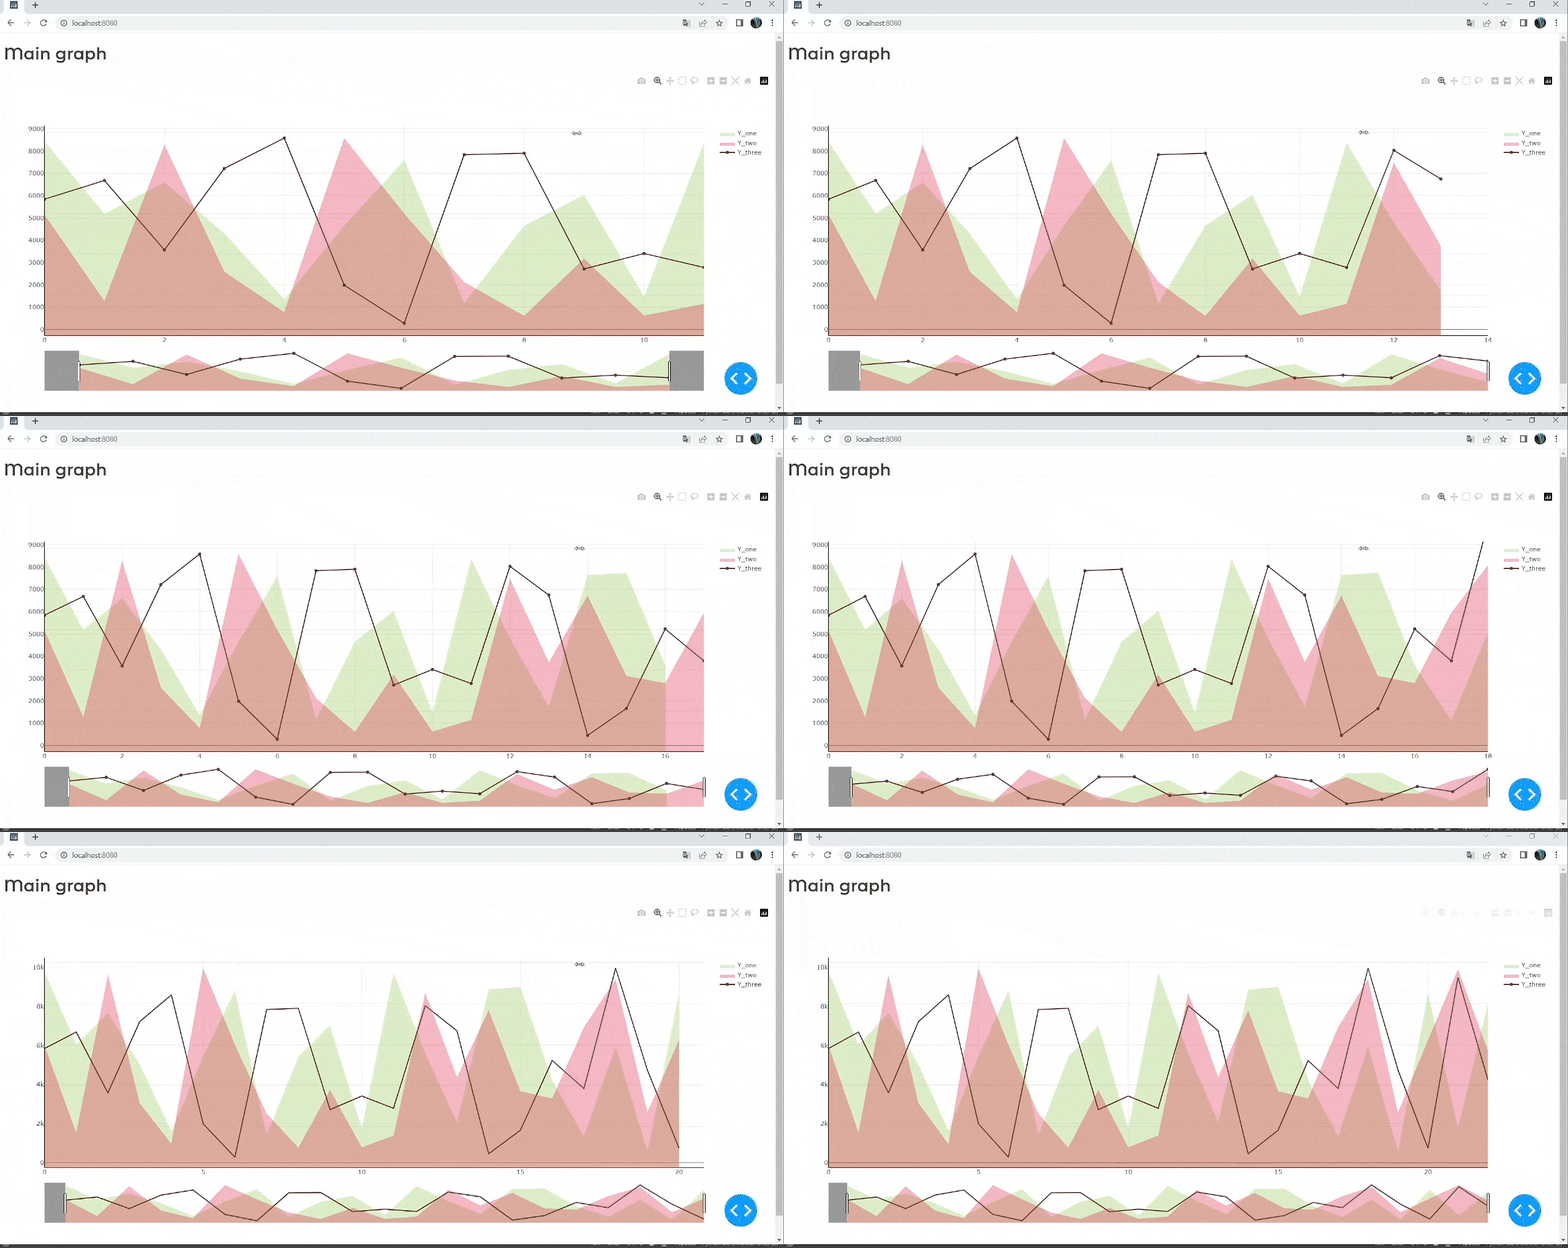
When starting the graph, everything goes well, it is updated once a second, as specified in the settings:
https://i.postimg.cc/L8yCj6Dw/normal.gif
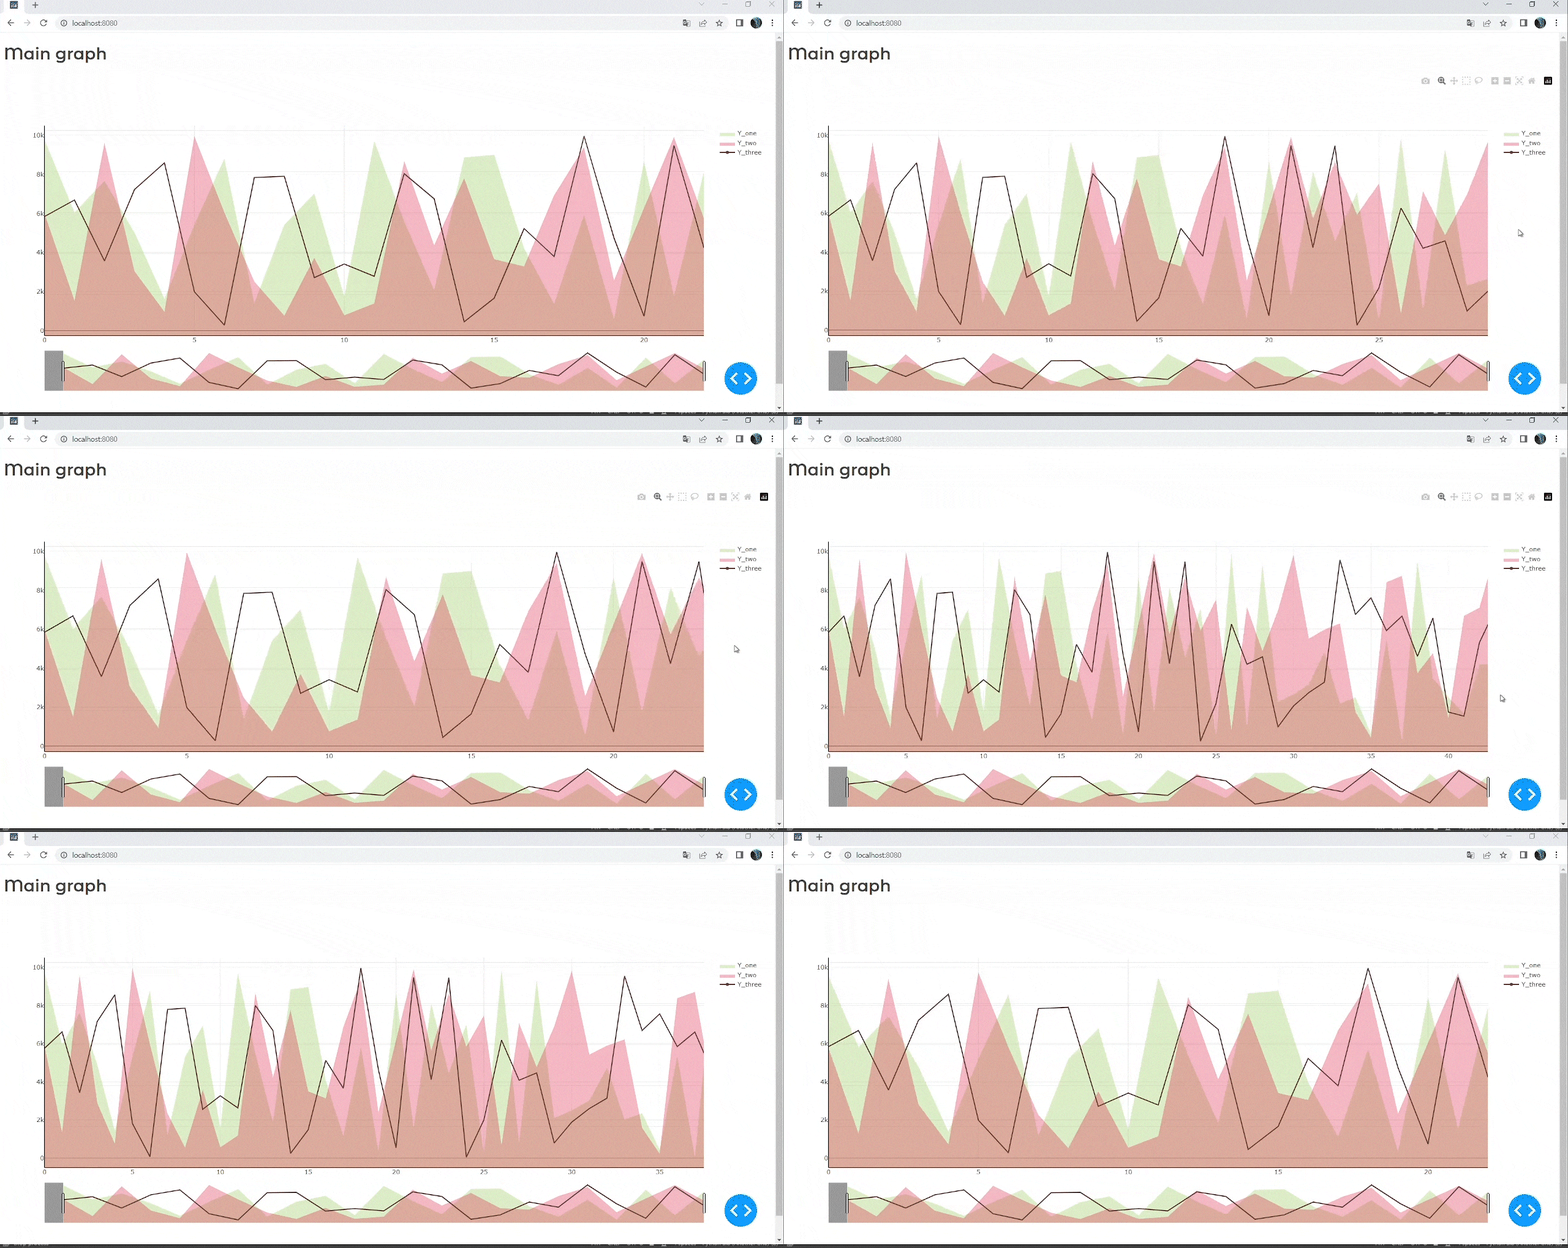
But if I switch to another tab or window (i.e. I don't look at the chart), then when I return, the chart starts to update quickly, compressing and decompressing like a spring:
https://i.postimg.cc/BvXhp9w6/glitch.gif
How can I solve this situation?
And as an addition: could you recommend a good raftly dash guide that will show solutions to similar problems?