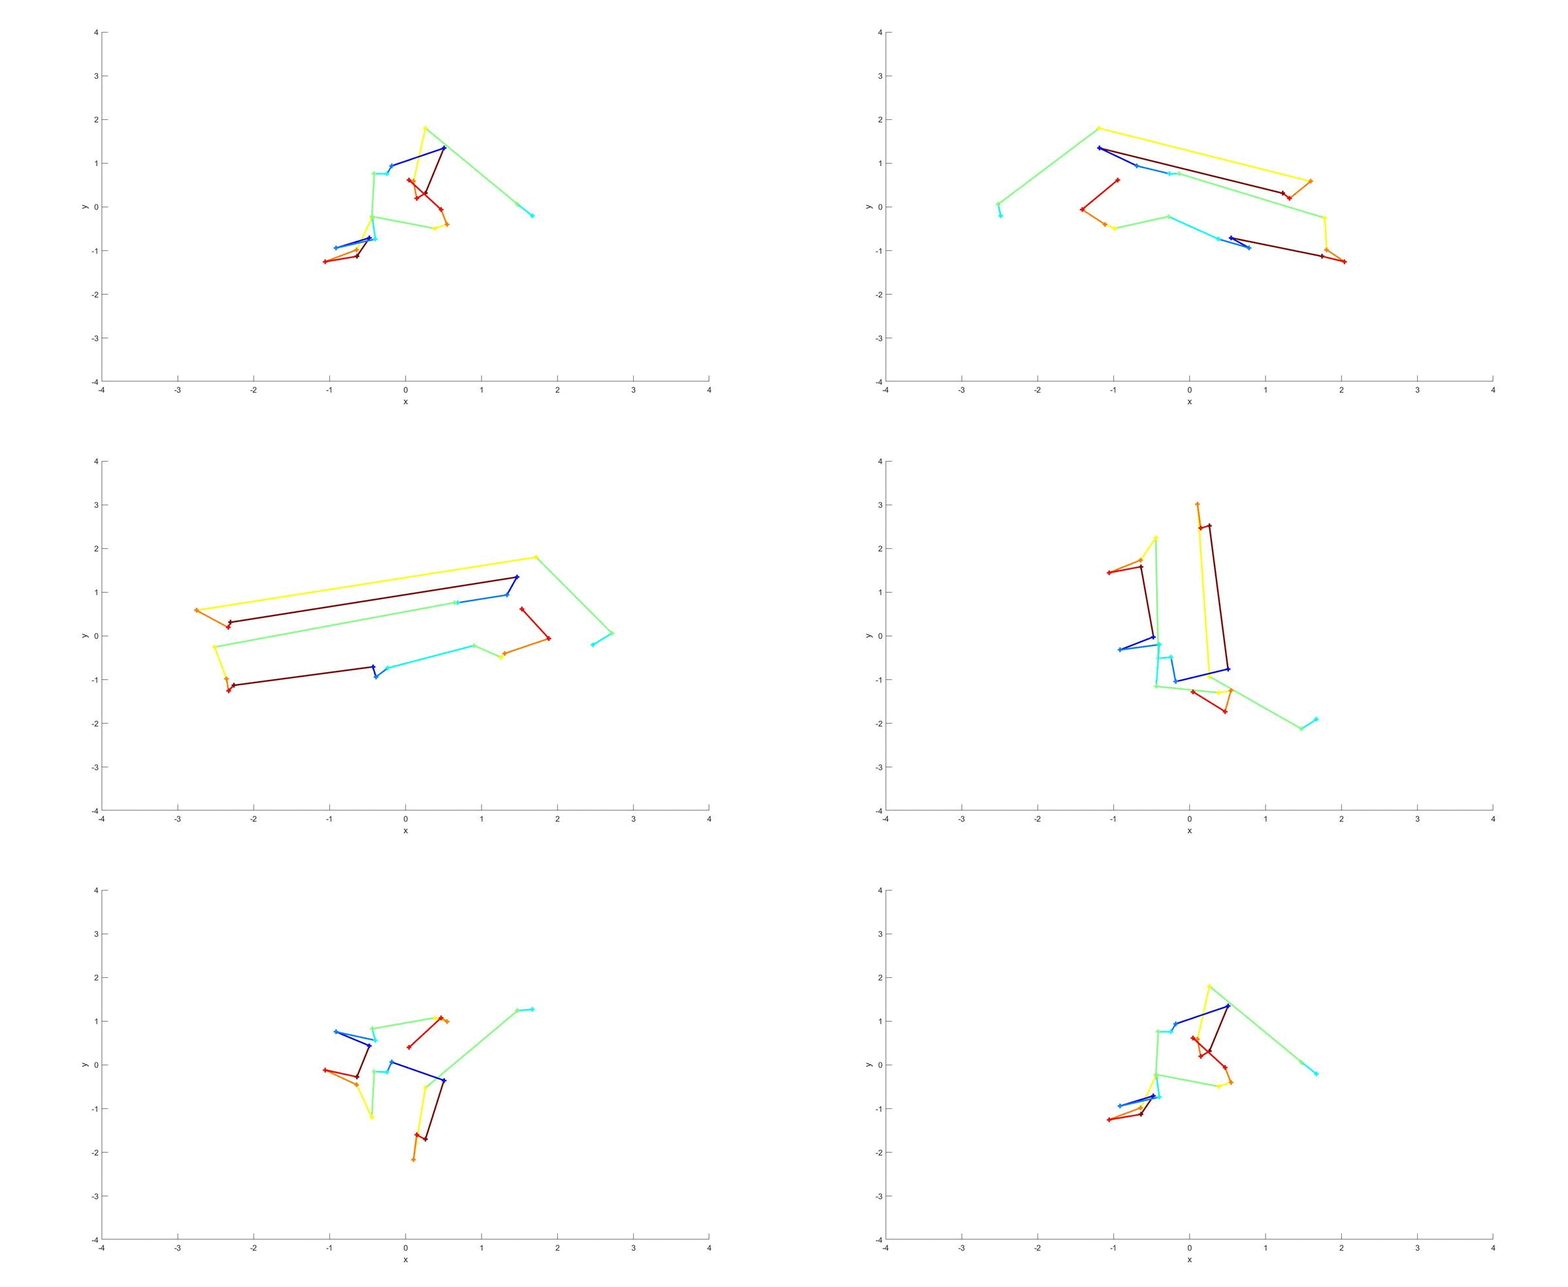
I would like to rotate the below example image along the x and y axis, 360 degree. Save the rotated images so that I can create a gif from the saved files.
I used the scipy module with numpy but the output doesn't align with the intended output.
import scipy.misc from scipy import ndimage import matplotlib.pyplot as plt img = cv2.imread('ax2_figure.png')
plt.figure(figsize=(15, 15))

for degree in range(5):
    plt.subplot(151+degree)
    rotated_img = ndimage.rotate(img, degree*60)
    plt.imshow(rotated_img, cmap=plt.cm.gray)
    plt.axis('off')

plt.show()

The array that was used to generate the plots.
xy = array([[ 2.56565867, -0.68453676],
       [ 2.7705649 , -0.76470133],
       [ 1.46815589, -1.31265774],
       [-2.70396748, -0.29326683],
       [-2.20821359, -0.02249133],
       [-2.21705997, -0.18584148],
       [ 1.30286825, -1.12362756],
       [ 1.33454447, -0.36799136],
       [ 0.72123042, -0.19116007],
       [ 0.699896  , -0.08678013],
       [-2.22643656,  0.70455435],
       [-1.86659744,  1.38624018],
       [-1.74510161,  1.87923624],
       [-1.73131744,  1.49670437],
       [-0.01485659,  1.07782199],
       [ 0.12371347,  1.53934113],
       [ 0.18156564,  1.04662112],
       [ 1.20251175,  0.68040644],
       [ 1.55150657,  0.36432144],
       [ 1.56232503,  0.19121897],
       [ 2.07646198, -0.02316096],
       [ 1.57910992, -0.26536205]])

fig, ax = plt.subplots()
    for start, stop in zip(xy[:-1], xy[1:]):
        x, y = zip(start, stop)
        ax.plot(x, y, color=uniqueish_color())
    plt.show()
example image

output image in gif format.
The image is large about 3MB so I added a link to the image. image