Bubble map animation using python

Viewed 124
1 Answers

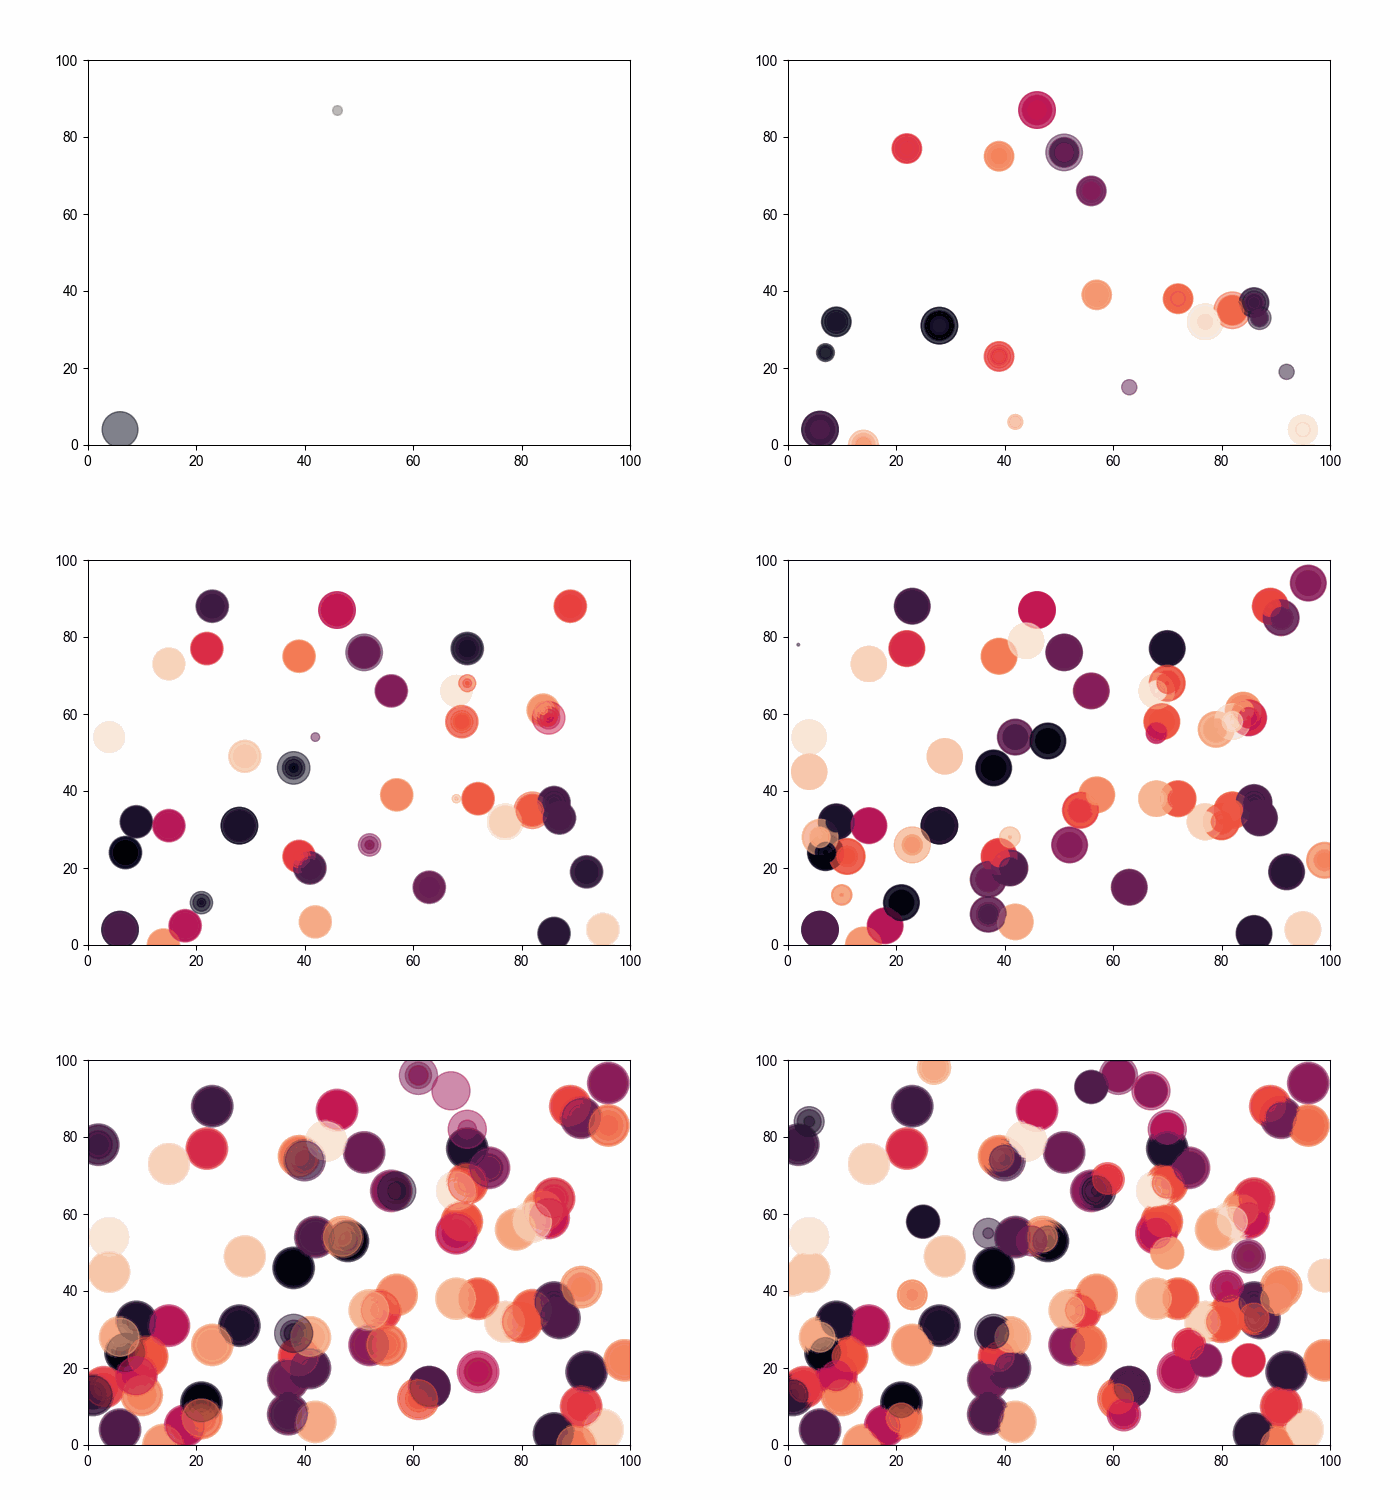
This will not be supported in Altair/Vega-Lite until https://github.com/vega/vega/issues/641 is addressed. You might be able to use Plotly animations for this, but I am unsure if they support fading in and out like in your example. It seems like you could also use matplotlib for a similar effect, like what is suggested in this blog post:

from matplotlib import pyplot as plt
from matplotlib.animation import FuncAnimation
import random
import numpy as np
  
x = []
y = []
colors = []
fig = plt.figure(figsize=(7,5))
  
def animation_func(i):
    x.append(random.randint(0,100))
    y.append(random.randint(0,100))
    colors.append(np.random.rand(1))
    area = random.randint(0,30) * random.randint(0,30)
    plt.xlim(0,100)
    plt.ylim(0,100)
    plt.scatter(x, y, c = colors, s = area, alpha = 0.5)
  
animation = FuncAnimation(fig, animation_func, 
                          interval = 100)
plt.show()

Related