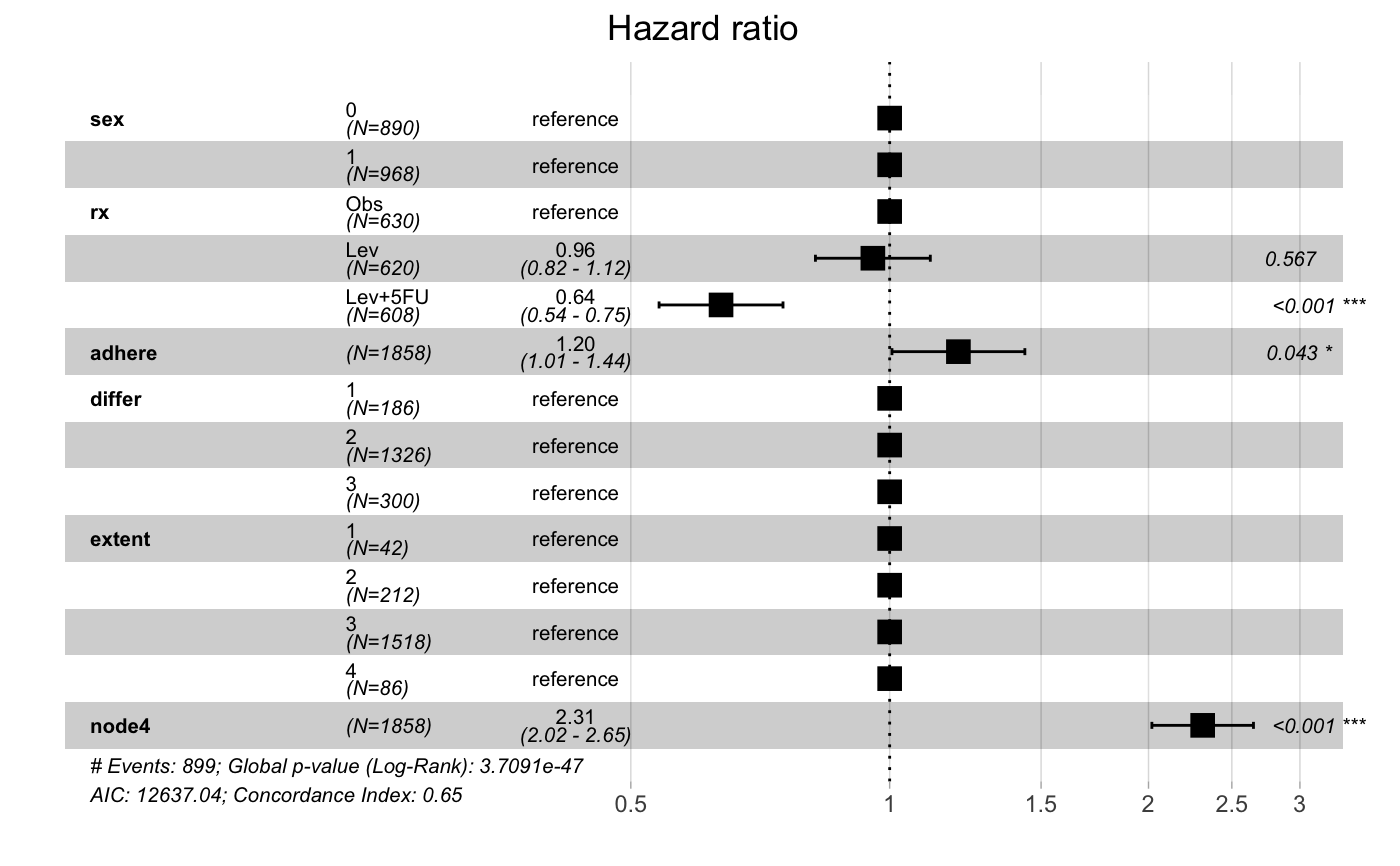
I use the "lung" dataset of the survival package, which I added some columns to ("treatment", "age60").
Basically I calculated the HR for an event (death) depending on the treatment like this:
library(survival)
library(survminer)
library(dplyr)

set.seed(123)

dataset = lung
dataset$treatment <- round(runif(228, min = 0, max = 1))

dataset <- dataset %>%
  mutate(age60 = case_when(
    age <= 60 ~ 0,
    age > 60 ~ 1))

model1 <- coxph(Surv(time, status) ~ treatment, data = dataset)
summary(model1)
Now I know, that treatment reduces the risk of dying (exp(coef) = 0.91).
So here are my questions:
In a next step I would like to analyze exactly this treatment effect in subgroups of the dataset, f.e. between males and females, between under and over 60 years of age or by another grouping variable "ph.ecog". But I would like to calculate HRs for just treatment on death by always only ONE grouping variable, f.e. treatment effect on death between males and females, or in another analysis treamtent effect on death between under and over 60 years.
These different (independent) HR I would like to show in a forest plot like this https://rpkgs.datanovia.com/survminer/reference/ggforest-2.png. In the first row I would like to show the overall HR of the treatment (independent from subgroup analysis, which I assume is model1) and below for every grouping variable like in the example (male/female, under/over 60 years, different types of "ph.ecog") - so it should look like this (the HRs are just random):
sex > 0 > reference | sex > 1 > 1.34
age60 > 0 > reference | age60 > 1 > 3.48
ph.ecog > 0 > reference | ph.ecog > 1 > 2.70 | ph.ecog > 2 > 1.43 | ph.ecog > 3 > 4.92.
The key information a reader of this plot should get is: What is the treatment effect of the drug (treament = 1) on dying (status = 2) in the different subgroups (male/female, age below or above 60, etc.).
I hope I explained everything that is needed to answer my question.
Thank everyone for support!