
Say I have the following code that generates a dataframe:
df = pd.DataFrame({"customer_code": ['1234','3411','9303'],
                   "main_purchases": [3,10,5],
                   "main_revenue": [103.5,401.5,99.0],
                   "secondary_purchases": [1,2,4],
                   "secondary_revenue": [43.1,77.5,104.6]
                  })

df.head()

There's the customer_code column that's the unique ID for each client.
And then there are 2 columns to indicate the purchases that took place and revenue generated from main branches by those clients.
And another 2 columns to indicate the purchases/revenue from secondary branches by those clients.
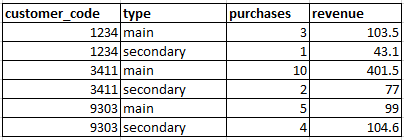
I want to get the data into a format like this, where a pivot is done where there's a new column to differentiate between main vs secondary, but the revenue numbers and purchase columns are not mixed up:
The obvious solution is just to split this into 2 dataframes, and then simply do a concatenate, but I'm wondering whether there's a built-in way to do this in a line or two - this strikes me as the kind of thing someone might have thought to bake in a solution for.