Shift numpy array data to make it only grow

Viewed 92

I have numpy array named data_saw that contains thousands of float numbers.

When visualized, it looks like this
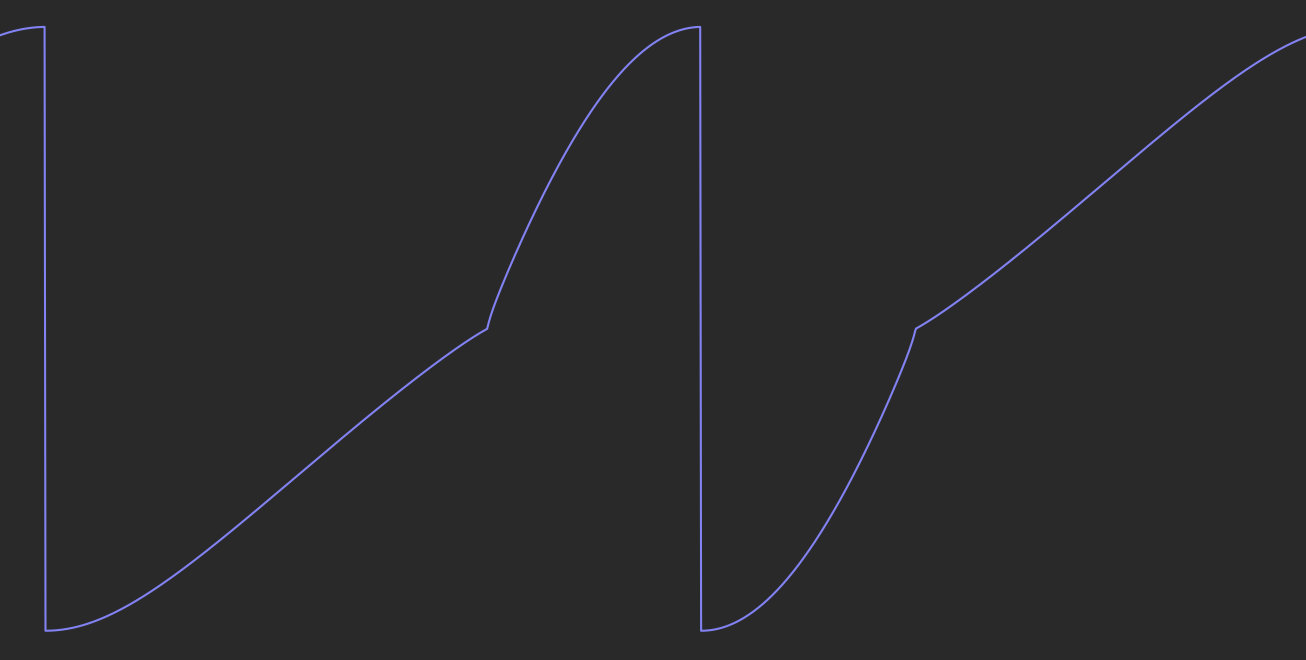
like this

My task is to shift down each element before gap by 180 (because each gap range here is around 180), so I will get continuous growing only line without gaps
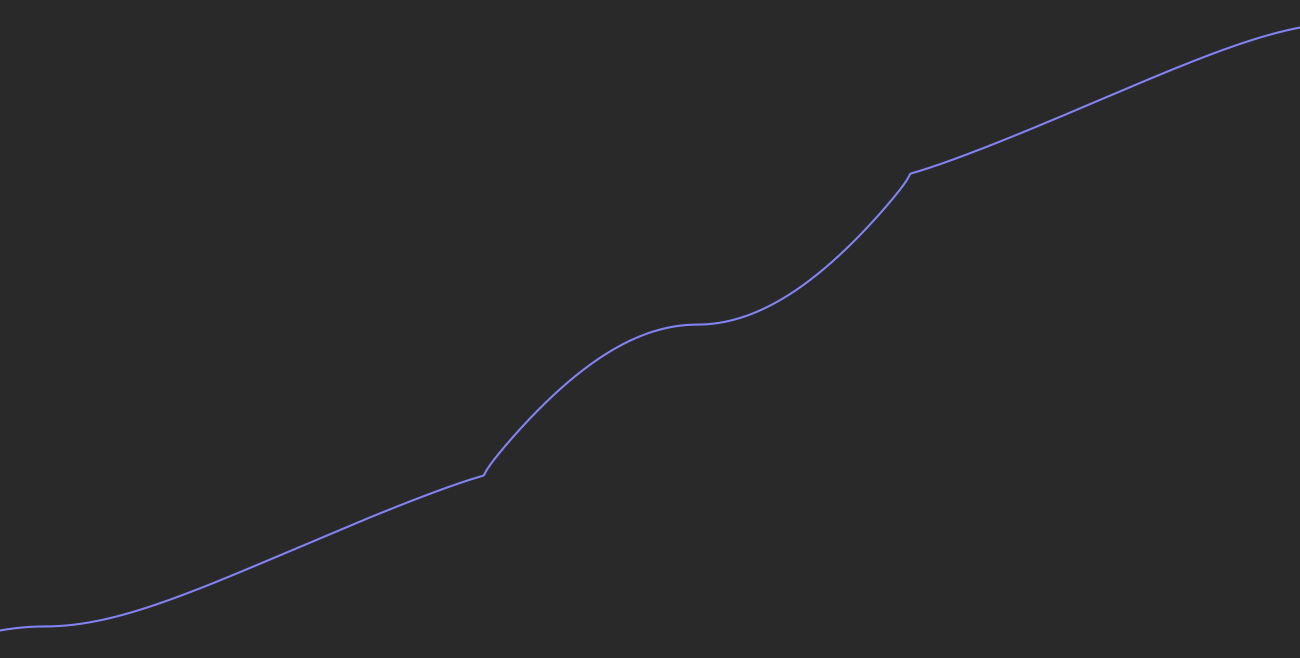
continuous growing only line without gaps

I've ended up with looping through array and checking for a gap at every index (the last element is for comparison only and is not needed in further calculations, so it is just deleted after alignment):

for i in range(1, len(data_saw)):
    if data_saw[i - 1] > data_saw[i]:
        data_saw[:i] -= 180
data_saw = np.delete(data_saw, -1)

Trying to find out if there are more correct ways to do this with numpy array. Are there any?

2 Answers

np.diff will tell you when the gap is bigger than some threshold

mask = np.diff(data_saw) < -90

To make mask the same size as data_saw, prepend a zero, because the result of diff is always smaller than the input by one element. For what I have in mind, you'll also want to convert to an integer type:

offset = np.concatenate(([0], mask)).cumsum()

To normalize the data, just add 180 * offset plus some arbitrary bias:

data_fixed = data_saw + 180 * offset

To keep the last segment at its original value:

data_fixed = data_saw + 180 * (offset - offset[1])

To keep the second segment as-is:

data_fixed = data_saw + 180 * (offset - offset[-1])

You can use a similar method to adjust data not only with arbitrary numbers of gaps, but even arbitrary gap sizes above some threshold.

First, compute the indices corresponding to the orignal mask using np.flatnonzero:

delta = np.diff(data_saw)
indices = np.flatnonzero(delta < -90)

Now you can simply fill in the bad elements of delta, for example with the average of the two surrounding elements:

delta[indices] = 0.5 * (delta[indices - 1] + delta[indices + 1])

The fixed data is the cumulative sum (with a zero prepended):

data_fixed = np.concatenate(([0], delta)).cumsum() + data_saw[0]

Not sure if it is more correct, but uses numpy's native methods.

import numpy as np
import matplotlib.pyplot as plt

array = np.arange(90)
array = np.concatenate([array[:30], array[30:] + 180, array[60:] + 2 * 180 + 30])
plt.plot(array)

enter image description here

adjusted = array - np.concatenate([[0], ((np.diff(array) >= 180).cumsum() * 180)])
plt.plot(adjusted)

enter image description here

Related