
When I add static data to a chart created with TikZ and include_tikz() from R/exams, they are rendered correctly. For example I have created the following graphic
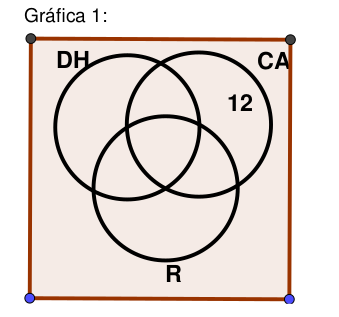
using exams::include_tikz(graf01, library = "arrows") with the TikZ code below. And then I can include it in exams2html(), exams2moodle(), etc.
 graf01<-c("\\definecolor{uuuuuu}{rgb}{0.26,0.26,0.26}",
      "\\definecolor{zzttqq}{rgb}{0.6,0.2,0}",
      "\\definecolor{ududff}{rgb}{0.30,0.30,1}",
      "\\begin{tikzpicture}[line cap=round,line join=round,>=triangle 45,x=1cm,y=1cm]",
      "\\clip(-0.1,-0.1) rectangle (5,5);",
      "\\fill[line width=2pt,color=zzttqq,fill=zzttqq,fill opacity=0.10] (0,0) -- (4.68,-0.02) -- (4.7,4.66) -- (0.02,4.68) -- cycle;",
      "\\draw (3.44,3.80) node[anchor=north west] {\\textbf{12}};",
      "\\draw (0.35,4.57) node[anchor=north west] {\\textbf{DH}};",
      "\\draw (3.97,4.57) node[anchor=north west] {\\textbf{CA}};",
      "\\draw (2.31,0.72) node[anchor=north west] {\\textbf{R}};",
      "\\draw [line width=2pt] (1.76,3.08) circle (1.3cm);",
      "\\draw [line width=2pt] (3.05,3.13) circle (1.3cm);",
      "\\draw [line width=2pt] (2.45,1.98) circle (1.3cm);",
      "\\draw [line width=2pt,color=zzttqq] (0,0)-- (4.68,-0.02);",
      "\\draw [line width=2pt,color=zzttqq] (4.68,-0.02)-- (4.7,4.66);",
      "\\draw [line width=2pt,color=zzttqq] (4.7,4.66)-- (0.02,4.68);",
      "\\draw [line width=2pt,color=zzttqq] (0.02,4.68)-- (0,0);",
      "\\begin{scriptsize}",
      "\\draw [fill=ududff] (0,0) circle (2.5pt);",
      "\\draw [fill=ududff] (4.68,-0.02) circle (2.5pt);",
      "\\draw [fill=uuuuuu] (4.7,4.66) circle (2.5pt);",
      "\\draw [fill=uuuuuu] (0.02,4.68) circle (2.5pt);",
      "\\end{scriptsize}",
      "\\end{tikzpicture}")
Now instead of hard-coding the number 12 in graf01[7]
"\\draw (3.44,3.80) node[anchor=north west] {\\textbf{12}};"
I want to use a randomly-generated number, say:
vald <- sample(1:20, 1)
I tried using
"\\draw (3.44,3.80) node[anchor=north west] {\\textbf{vald}};"
but then the string vald instead of its value is included:
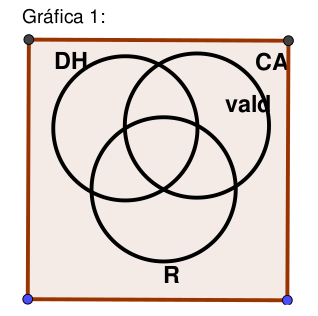
How can I include the value of vald instead?
