OutOfMemoryException in Java process, but Used Heap is about half of Used Size

Viewed 401

We are running a process that has a cache that consumes a lot of memory. But the amount of objects in that cache keeps stable during execution, while memory usage is growing with no limit.

We have run Java Flight Recorder in order to try to guess what is happening.

In that report, we can see that UsedHeap is about half of UsedSize, and I cannot find any explanation for that.

JVM exits and dumps a report of OutOfMemory that you can find here: https://frojasg1.com/stackOverflow/20210423.outOfMemory/hs_err_pid26210.log

Here it is the whole Java Flight Recorder report: https://frojasg1.com/stackOverflow/20210423.outOfMemory/test.7z
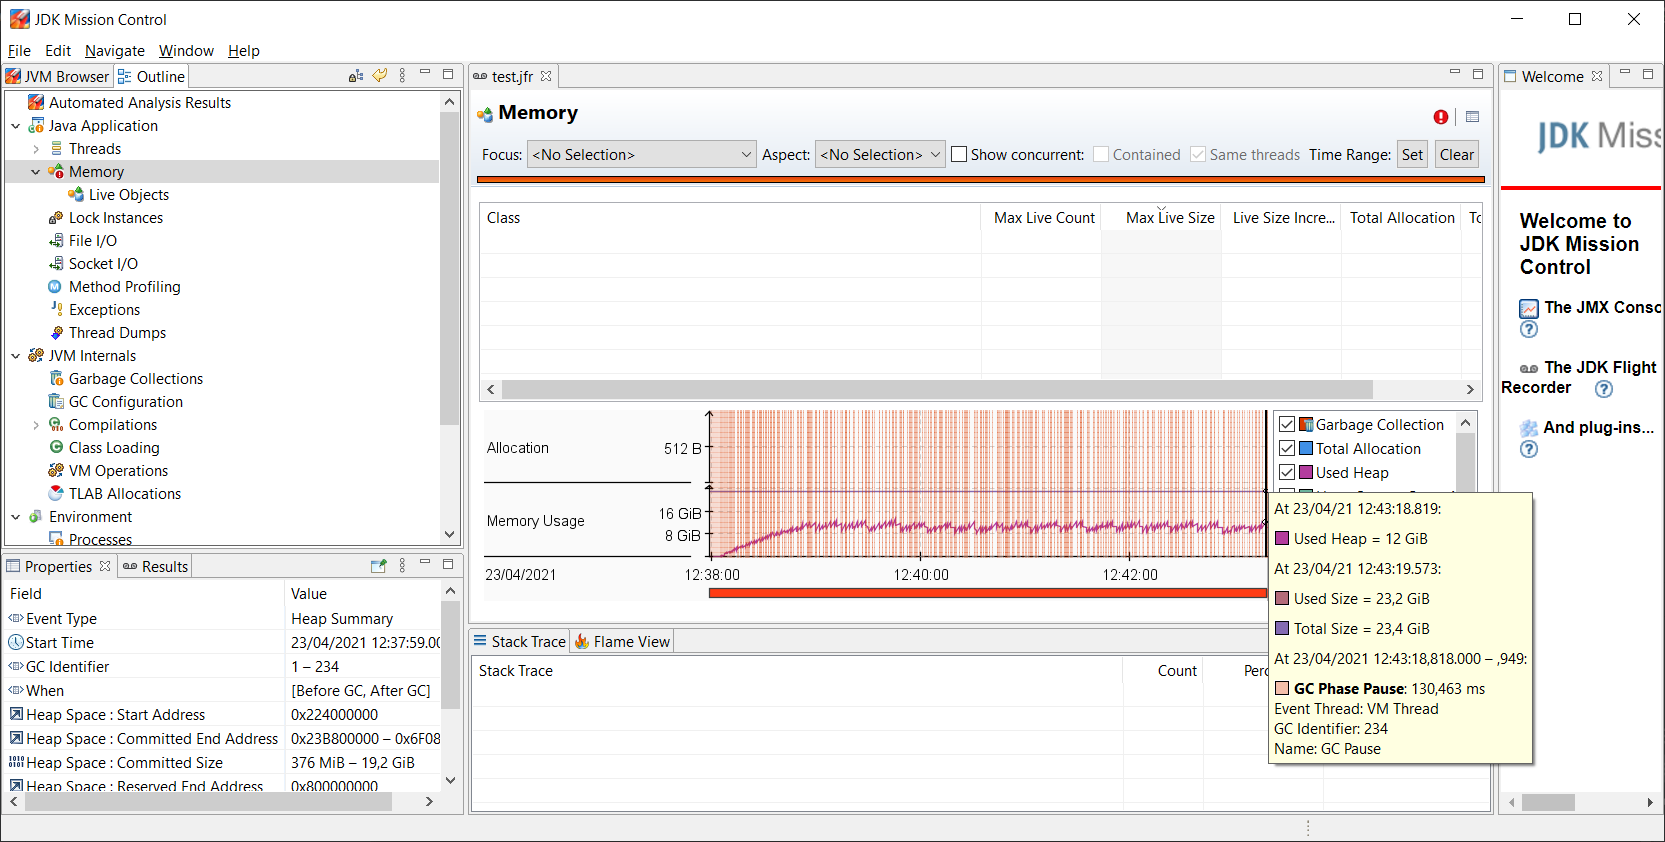
And a sample of that report

Does anybody know why this outOfMemory is arising?

May be I would have to change the question ... and ask: Why are there almost 10 GB of used memory that is not used in heap?

2 Answers

The log file says this:

# Native memory allocation (mmap) failed to map 520093696 bytes 
for committing reserved memory.

So what has happened is that the JVM has requested a ~500MB chunk of memory from the OS via an mmap system call and the OS has refused.

When I looked at more of the log file, it is clear that G1GC itself is requesting more memory, and it looks like it is doing it while trying to expand the heap1.

I can think of a couple of possible reasons for the mmap failure:

  1. The OS may be out of swap space to back the memory allocation.

  2. Your JVM may have hit the per-process memory limit. (On UNIX / Linux this is implemented as a ulimit.)

  3. If your JVM is running in a Docker (or similar) container, you may have exceeded the container's memory limit.


This is not a "normal" OOME. It is actually a mismatch between the memory demands of the JVM and what is available from the OS.

  • It can be addressed at the OS level; i.e. by removing or increasing the limit, or adding more swap space (or possibly more RAM).

  • It could also be addressed by reducing the JVM's maximum heap size. This will stop the GC from trying to expand the heap to an unsustainable size2. Doing this may also result in the GC running more often, but that is better than the application dying prematurely from an avoidable OOME.


1- Someone with more experience in G1GC diagnosis may be able to discern more from the crash dump, but it looks like normal heap expansion behavior to me. There is no obvious sign of a "huge" object being created.
2 - Working out what the sustainable size actually would involve analyzing the memory usage for the entire system, and looking at the available RAM and swap resources and the limits. That is a system administration problem, not a programming problem.

May be I would have to change the question ... and ask: Why are there almost 10 GB of used memory that is not used in heap?

What you are seeing is the difference between memory that is currently allocated to to the heap, and the heap limit that you have set. The JVM doesn't actually request all of the heap memory from the OS up front. Instead, it requests more memory incrementally ... if required ... at the end of a major GC run.

So while the total heap size appears to be ~24GB, the actual memory allocated is substantially less than that.

Normally, that is fine. The GC asks the OS for more memory and adds it to the relevant pools for the memory allocators to use. But in this case, the OS cannot oblige, and G1GC pulls the plug.

Related