
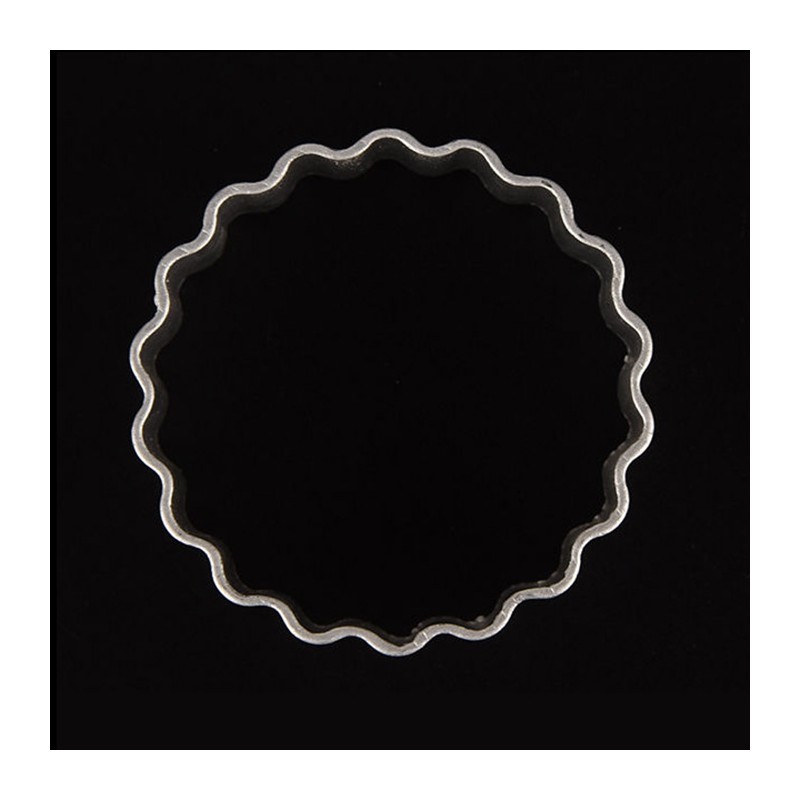
I'm looking for a way to plot a corrugated circle in Python.
 My attempt doesn't produce the correct output:
from matplotlib import pyplot as plt
import numpy as np
from math import pi

x=np.linspace(-10,10,100)
y=x

X, Y = np.meshgrid(x,y)

circle = (X-np.cos(2*pi*0.2*Y))**2 + (Y-np.sin(2*pi*0.2*X))**2 - 5.

plt.contour(X,Y,circle,[0])
plt.show()

theta = np.linspace(-pi,pi,100)
courbure = np.sin(theta*10)

plt.plot(theta,courbure)
plt.show()

circle2 = (X-(courbure*np.cos(theta)))**2 + (Y-np.sin(theta)*courbure)**2 - courbure**2
plt.contour(X,Y,circle2)
plt.show()

Thank you.