Actually i do not use profiling tools that often. But it sound interesting that total CPU time does not sum up to total execution time. I searched it and i want to share my findings with my thought process.
What does official documentation say about it?
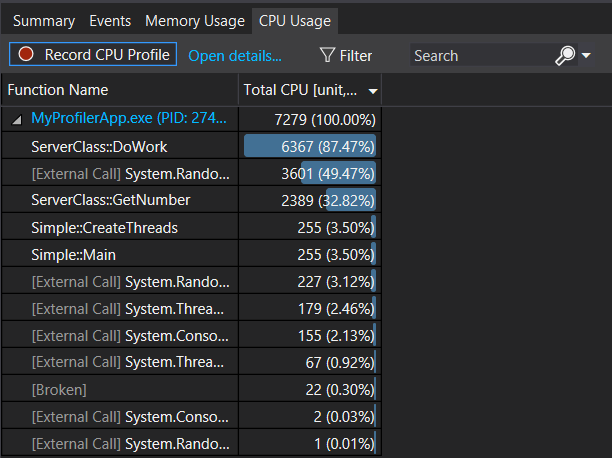
I looked at here, it doesn't says much. Then here and i found a quite interesting point. As you can see below the documentation includes a demo that shows CPU Usage tab like yours. But there are [External Call] tagged functions and they are not trivial. Documentation states:
External code are functions in system and framework components that are executed by the code you write. External code include functions that start and stop the app, draw the UI, control threading, and provide other low-level services to the app. In most cases, you won't be interested in external code, and so the CPU Usage tool gathers the external functions of a user method into one [External Code] node.
Since your examples does not include this functions, maybe they are creating this margin between exec time - total cpu time. You can check out this link view the call paths of external code in CPU Usage tab. They are disabled by default.

But even if this case is true, it do not explain the time difference 1000ms - 50s.
Keep looking..
After little bit of searching i found this. Another documentation about analyzing CPU Usage. The demo they are using was very similar to yours as you can se below. Even with the external code there is a nearly 60s difference. This is where i started to think Are we comparing apples with peanuts?.

In the usage tab it says Total CPU [unit, %]. What unit is exactly? In the same documentation above, they states:
Total CPU [unit, %]
The milliseconds and CPU percentage used by calls to the function, and functions called by the function, in the selected time range. This is different from the CPU Utilization timeline graph, which compares the total CPU activity in a time range to the total available CPU.
Ok it is in milliseconds, we get it. But what is exactly it representing.
CPU Usage metrics
I searched it a lot and came across this post and it redirect me to this moldy documentation. It is about Profiler Instrumentation Data and they states that:
Time The time in milliseconds (msec) or processor cycles (ticks) that was spent in the direct execution of this function, excluding time spent in child functions called by this function.
After that i looked at much more newer documentation but they referred it as only milliseconds like the quote above. But this old documentation give me a spark. If they are referring the cpu cycle count, this explains it all. They are not including idle state, interrupts, locks and job priority in account. Actually it is a wise thing to do when you think about it. CPU processes functions in a discrete manner. In this way you can get more consistent results every time.
Your Question
If i did my research right, i think when you start execution, it captures the time your functions spend with cpu. It will not add this events duration in captured time: functions waiting for each other, functions waiting for I/O, os decides to take over process, high priority process take over, thread locks, WINDOWS UPDATE... Even if total captured time of the functions is 1ms it can take minutes to complete task depending on the computer. CPU execution time is discrete but time between breakpoints is continuous. This is why you have margin between them.