
I'm writing a function to calculate a Shannon diversity index. I have wide data with the pct of observations for each value as separate variables, with each row representing a different site. I will have between 2 and 7 variables depending on the data set. For each row I want to calculate the information index.
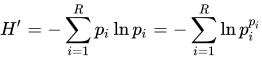
I have a loop function, but its quite slow and am looking for help to vectorize it. I'm also happy for a tidyverse style solution.
I've been looking at using the entropy package, but it seems to expect the data in long form, and while I could expand my data back out, that seems like it would be unnecessarily slow. I currently have 20k sites with 100's to 1000's of observations per site that have already been summarized into the wide format percent distributions. This question similarly works with long form data.
Example data
# Wide data, between 2 and 7 columns recording the percent of observations with each value, example using 3
df <- data.frame(
  site = 1:3,
  l1 = c(.33, .5, 0),
  l2 = c(.33, .5, 0),
  l3 = c(.33, 0, 1)
)
Current loop function
entropy <- function(df, vars) {

  entropy_calc <- function(df, i, vars) {
    sum <- 0
    for (j in vars) {
      x <- df[i,j]
      if(x != 0) { # skip zeros
        sum <- sum + x * log(x)
      }
    }
    return(-sum)
  }

  entropy <- rep(NA, nrow(df))
  for(i in 1:nrow(df)) {
    entropy[i] <- entropy_calc(df, i, vars)
  }

  return(as.numeric(entropy))
}

df$entropy <- entropy(df, 2:4)