How to set X and Y axis Title in matplotlib.pyplot

Viewed 22026

I have imported:

%matplotlib inline %config InlineBackend.fugure_format = 'retina' import matplotlib.pyplot as plt

to show:

plt.plot(train_losses, label='Training loss') plt.plot(test_losses, label='Test/Validation loss') plt.legend(frameon=False)
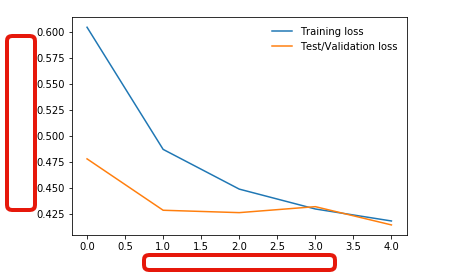
graph

I have tried plt.xlabel('X axis title') and plt.ylabel('Y axis title) and several other codes but none are working.

I'm just trying to label the x, y axis.

1 Answers

See let us consider that your dataset to make the graph can be divided into 4 parts,train_losses_x,train_losses_y,test_losses_x and test_losses_y.So it can be used as following

fig,ax=plt.subplot()
train_line=ax.plot(train_losses_x,train_losses_y,label="Training Loss")
test_line=ax.plot(test_losses_x,test_losses_y,label="Test/Validation Loss")
ax.set_xlabel("X_axis_title")
ax.set_ylabel("Y_axis_title")
legend = ax.legend(loc='upper right')
plt.show()

I hope this help you.

Related