
I have imported:
%matplotlib inline
%config InlineBackend.fugure_format = 'retina'
import matplotlib.pyplot as plt
to show:
plt.plot(train_losses, label='Training loss')
plt.plot(test_losses, label='Test/Validation loss')
plt.legend(frameon=False)
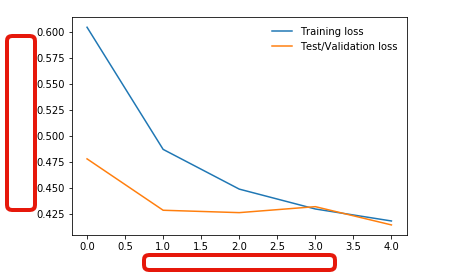
I have tried plt.xlabel('X axis title') and plt.ylabel('Y axis title) and several other codes but none are working.
I'm just trying to label the x, y axis.