how to draw lines in Pine script (Tradingview)?

Viewed 34040

Pine editor still does not have built-in functions to plot lines (such as support lines, trend lines). I could not find any direct or indirect method to draw lines. I want to build function that look like below (for example only)

draw_line(price1, time1,price2, time2)

any Ideas or suggestions ?

4 Answers

This is now possible in Pine Script v4:
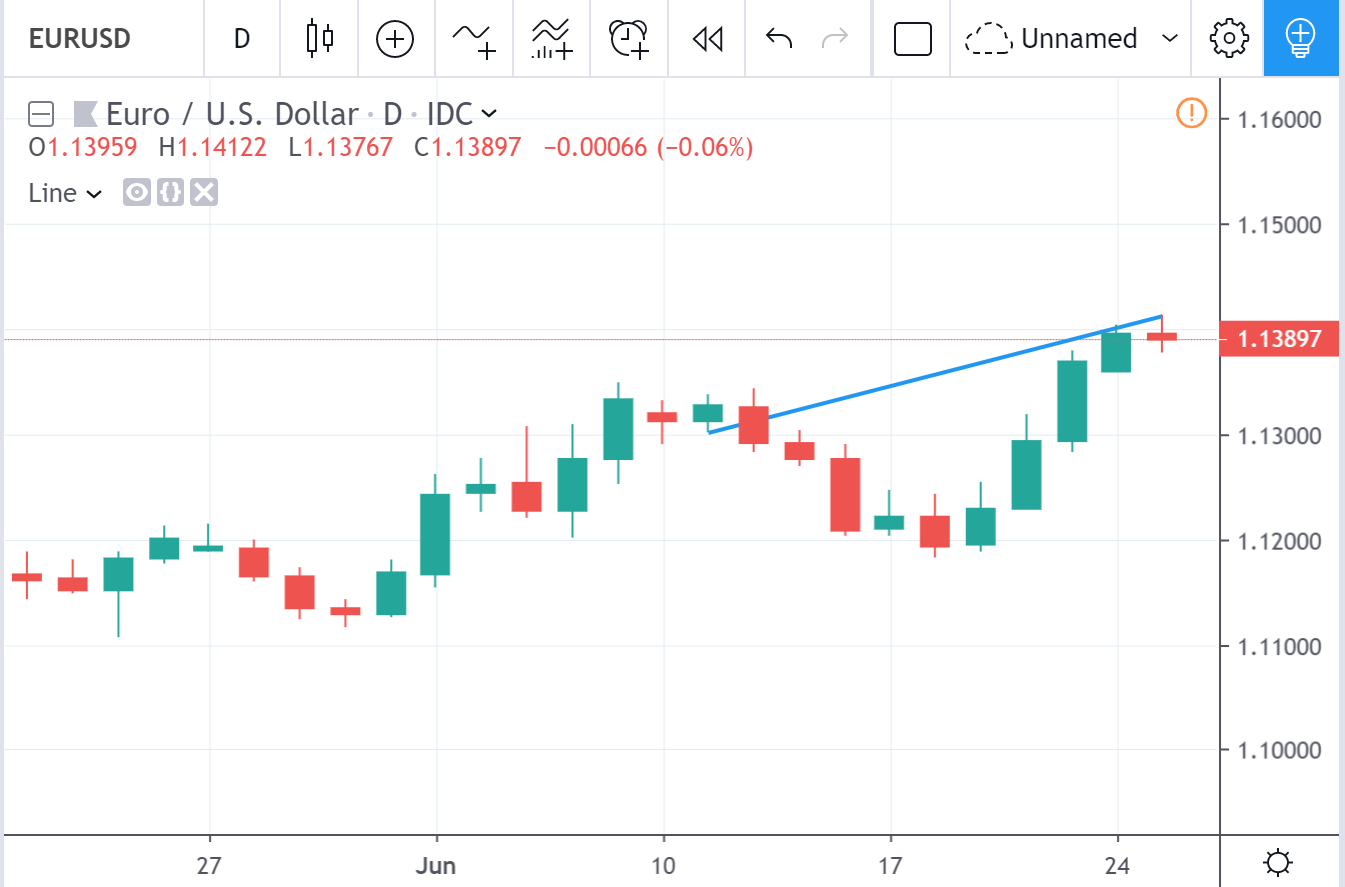
Preview

//@version=4
study("Line", overlay=true)
l = line.new(bar_index, high, bar_index[10], low[10], width = 4)
line.delete(l[1])

Here is a vertical line function by midtownsk8rguy on TradingView:

vline(BarIndex, Color, LineStyle, LineWidth) => // Verticle Line Function, ≈50-54 lines maximum allowable per indicator
    // return = line.new(BarIndex,   0.0, BarIndex,     100.0, xloc.bar_index, extend.both, Color, LineStyle, LineWidth) // Suitable for study(overlay=false) and RSI, Stochastic, etc...
    // return = line.new(BarIndex,  -1.0, BarIndex,       1.0, xloc.bar_index, extend.both, Color, LineStyle, LineWidth) // Suitable for study(overlay=false) and +/-1.0 oscillators
    return = line.new(BarIndex, low - tr, BarIndex, high + tr, xloc.bar_index, extend.both, Color, LineStyle, LineWidth) // Suitable for study(overlay=true)

if(bar_index%10==0.0) // Generically plots a line every 10 bars
    vline(bar_index, #FF8000ff, line.style_solid, 1) // Variable assignment not required

You can also use if barstate.islast if you only draw your lines once instead of on each candle, this way you don't need to delete the previous lines.

More compact code for draw lines:

//@version=3
study("Draw line", overlay=true)

plot(n, color=na, style=line)
AB(x1,x2,y1,y2) => n < x1 or n > x2 ? na : y1 + (y2 - y1) / (x2 - x1) * (n - x1)

plot(AB(10065,10136,3819,3893), color=#ff00ff, linewidth=1, style=line, 
transp=0)
plot(AB(10091,10136,3966.5,3931), color=#ff00ff, linewidth=1, style=line, 
transp=0)

Here is an example that might answer the original question:

//@version=4
study(title="trendline example aapl", overlay=true)

//@AAPL
line12= line.new(x1=int(1656322200000), 
y1=float(143.49), 
x2=int(1659519000000), 
y2=float(166.59), 
extend=extend.right, 
xloc=xloc.bar_time)

(to calculate the time it needs to be calculated as the *bar open time in unix milliseconds see: https://currentmillis.com/ ; can be calculated in excel with this formula = = (([date eg mm/dd/yyyy]+[bar open time eg 9.30am])- 0/24 - DATE(1970,1,1)) * 86400000 = ((6/27/2022+9:30:00 AM)- 0/24 - DATE(1970,1,1)) * 86400000 = ((44739+0.395833333333333)- 0/24 - DATE(1970,1,1)) * 86400000 = 1656322200000 ) adjust the zero/24 to offset the time zone if needed eg 1/24

Related