
I have taken a working Leaflet map, but when I added a JQuery Mobile header and back button the formatting went crazy.
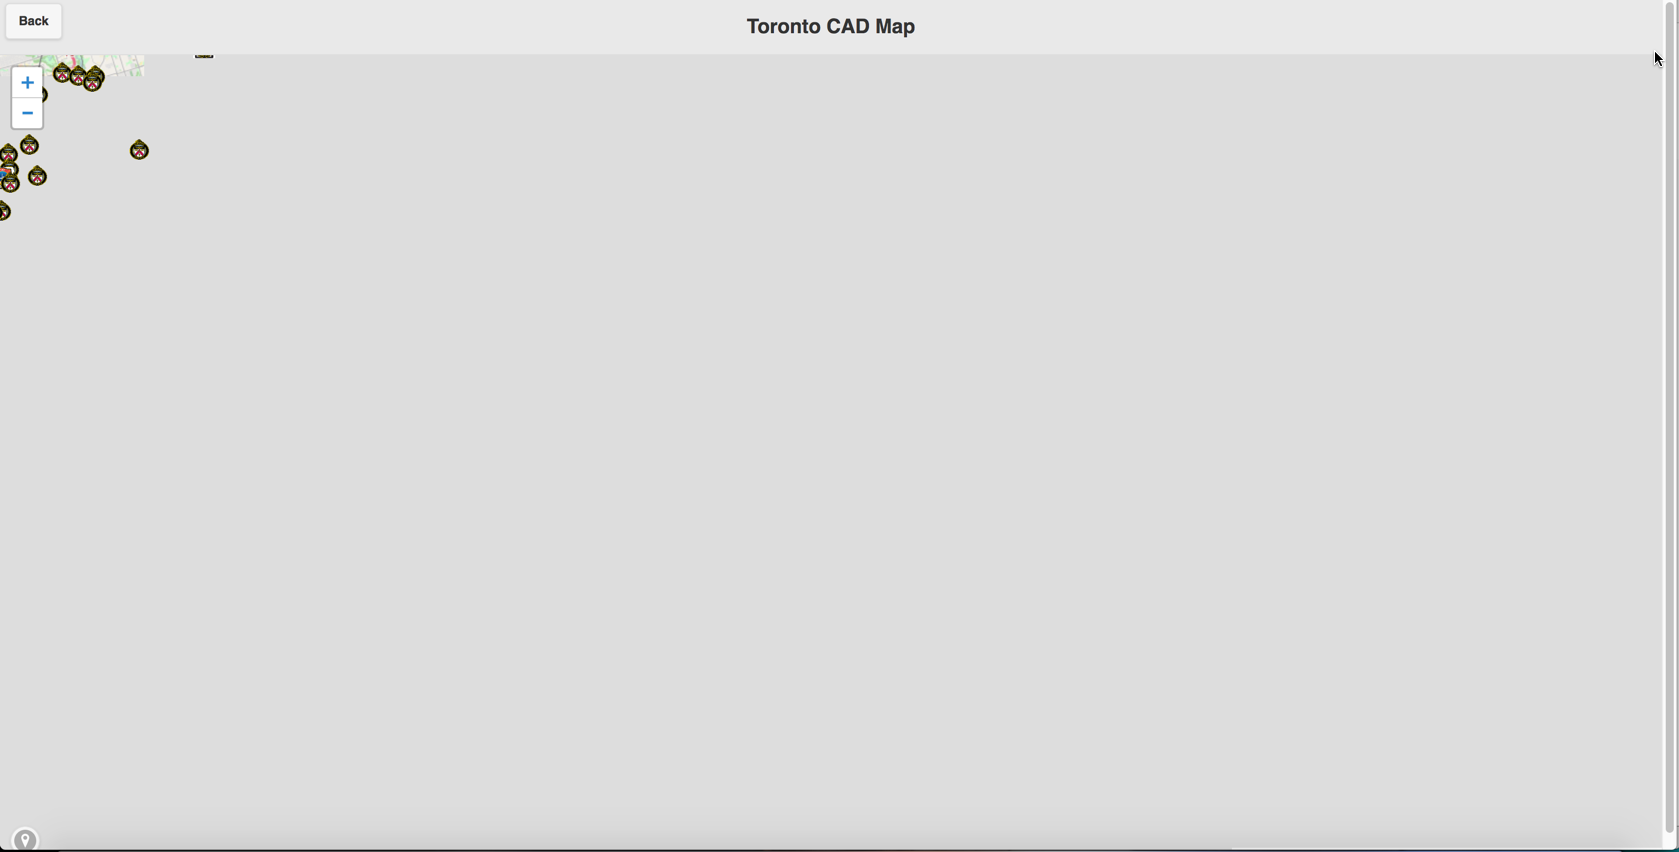
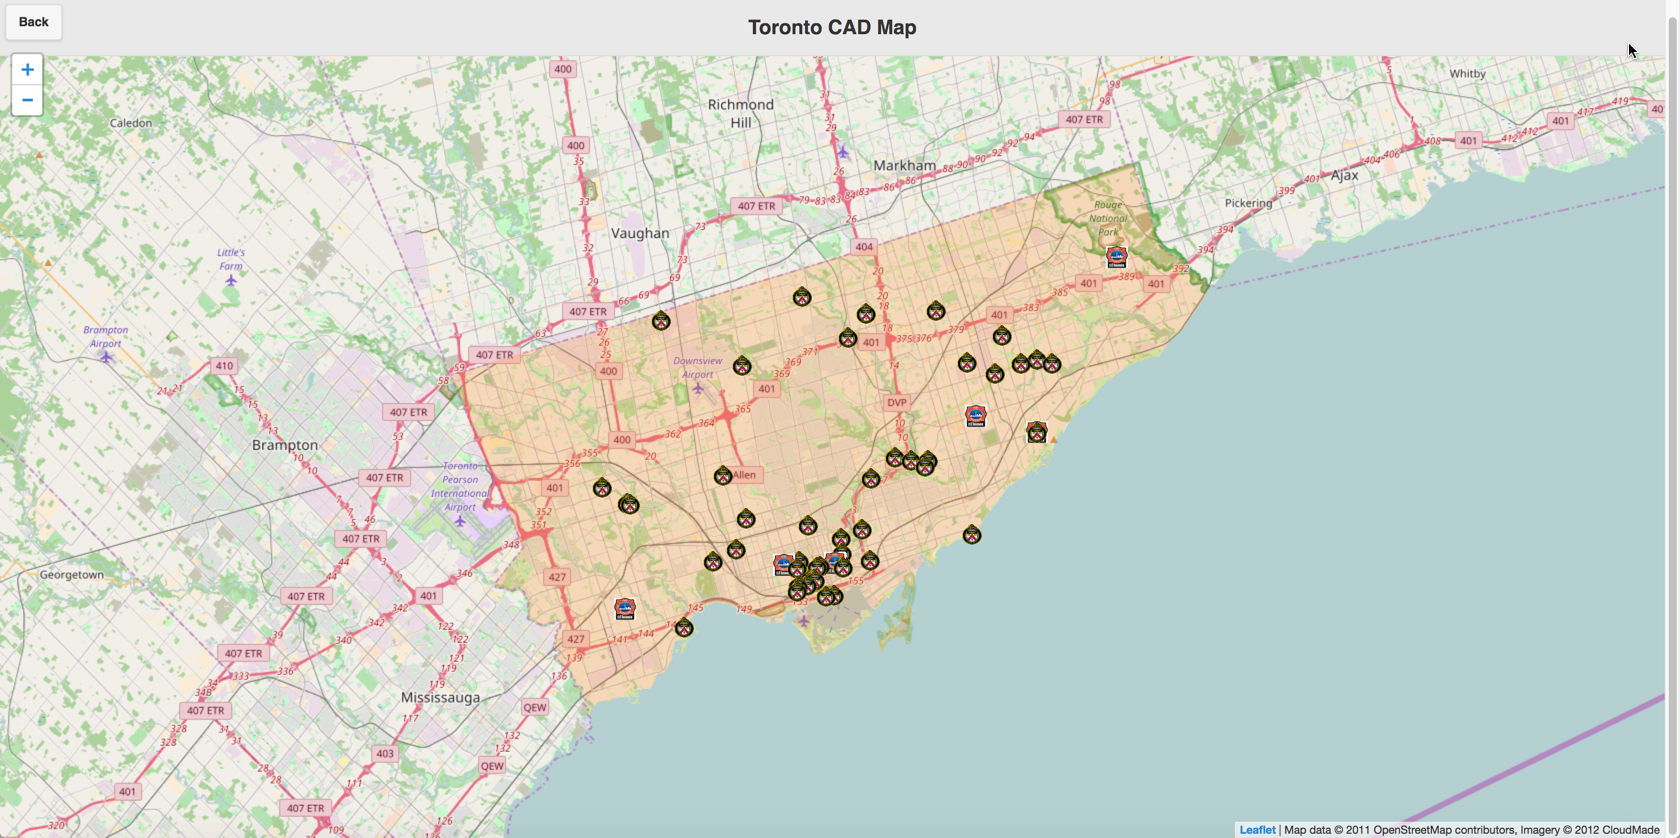
Initially loading the page all the contents is loaded in the upper-left-hand corner, but when the page is resized the smallest bit on a desktop, or rotated on a mobile, everything is fine.
This is what it looks like when opened:
and what it looks like after rotating (and what it should be):
Here is the code for the page
<!DOCTYPE html>
<html>
<head>
<title>Toronto CAD Activity Map</title>
<meta charset="utf-8" />
<meta name="viewport" content="width=device-width, initial-scale=1.0">
<link rel="stylesheet" href="../css/leaflet.css" />
<meta name="viewport" content="width=device-width, initial-scale=1">
<link rel="stylesheet" href="../css/tfscad.mobile.css" />
<link rel="stylesheet" href="../css/jquery.mobile-1.4.5.min.css">
<link rel="stylesheet" href="../css/font-awesome.min.css">
<script src="../js/jquery-1.11.1.min.js"></script>
<script src="../js/jquery.mobile-1.4.5.min.js"></script>
<script src="../js/iframeResizer.contentWindow.js"></script>
<!--[if lte IE 8]><link rel="stylesheet" href="../dist/leaflet.ie.css" /><![endif]-->
<style>
#mapPage {
height: calc(100% - 42px);
}
#map {
height: 100%;
}
#map-content{
height: 100%;
padding: 0px;
margin:0px;
z-index: -1;
}
#curLoc{
position: absolute;
bottom: 0;
left: 10px;
}
</style>
</head>
<body>
<body>
<div data-role="page" id="mapPage" data-theme="a">
<div data-role="header" data-position="fixed" data-theme="a">
<a id="backButton" href="#" data-rel="back"
data-transition="slide" data-direction="reverse">Back</a>
<h1>Toronto CAD Map</h1>
</div>
<div id="map-content" data-role="content">
<div id="map"></div>
</div>
<a id="curLoc" data-role="button" data-icon="location" data-iconpos="notext"></a>
</div>
<script src="../js/jquery-1.11.1.min.js"></script>
<script src="../js/leaflet.js"></script>
<script type="text/javascript">
window.onload = function() {
getGeoJson();
getTPSJson();
};
var map = L.map('map').setView([43.7178,-79.3762], 11);
L.tileLayer('https://{s}.tile.openstreetmap.org/{z}/{x}/{y}.png', {
attribution: 'Map data © 2011 OpenStreetMap contributors, Imagery © 2012 CloudMade',
}).addTo(map);
function getGeoJson(){
// load GeoJSON from an external file
$.getJSON("../appdata/geo.json",function(data){
L.geoJson(data ,{
pointToLayer: function(feature,latlng){
var TFS = new L.icon({
iconUrl: '../images/tfs_logo.png',
iconSize: [22, 22],
popupAnchor: [0, -22]
});
var TPS = new L.icon({
iconUrl: '../images/tps_logo.png',
iconSize: [22, 22],
popupAnchor: [0, -22]
});
var ESC = new L.icon({
iconUrl: '../images/tps_logo.png',
iconSize: [22, 22],
popupAnchor: [0, -22]
});
if(feature.properties.icon == 'TFS'){
var marker = L.marker(latlng,{icon: TFS});
marker.bindPopup('<strong>' + feature.properties.event_type + '</strong><br/>' + feature.properties.OPEN_DT);
return marker;
}else if(feature.properties.icon == 'TPS'){
var marker = L.marker(latlng,{icon: TPS});
marker.bindPopup('<strong>' + feature.properties.event_type + '</strong><br/>' + feature.properties.OPEN_DT);
return marker;
}else if(feature.properties.icon == 'ESC'){
var marker = L.marker(latlng,{icon: ESC});
marker.bindPopup('<strong>' + feature.properties.event_type + '</strong><br/>' + feature.properties.OPEN_DT);
return marker;
}
}
} ).addTo(map);
});
}
function getTPSJson(){
var myStyle = {
"color": "#ff7800",
"weight": 5,
"opacity": 0,
"offset": 1.5
};
// load GeoJSON from an external file
$.getJSON("../appdata/TPSDiv.json",function(myLines){
L.geoJson(myLines, {
style: myStyle
}).addTo(map);
})
}
setInterval(function()
{
getGeoJson();
}, 10000);//time in milliseconds
function onClick(e) {
//console.log(this.options.win_url);
window.open(this.options.win_url);
}
</script>
</body>