How to get Javascript Function Calls/Trace at Runtime

Viewed 50139

As I interact with my AJAX based application at RUNTIME I'd like the console to spit out all the functions it's calling. (so no stack trace, or breakpoints, or profiling or anything)

So for example, let's say I pressed a button on the page. I'd like for it to return all the functions it went through when that happened:

So I'd see in the console something like (when I pressed a button):

1. button1Clicked();
2.     calculating();
3.          printingResults();

Which basically means that button1Clicked() called calculating() which called printingResults()

Is there a utility, or plugin, browser, or maybe some way in the language to do this? I'm using google chrome, btw.

p.s and NO I do not want to go through each function and add a "console.log("inside function X")" b/c that's too much work

p.p.s as an added bonus I'd like to see the arguments passed into the functions too, but maybe that's pushing it. :>
9 Answers

I just found out that you could do that with a console.trace()

Let me throw a third solution into the ring: an omniscient debugger.

Note that all other answers offer two kinds of solutions:

  1. Manually patch your JS functions in run-time, and log them to console
    • Yes it can get the job done, but will be useless once your project grows to a certain size. It does not give you sufficient controlability, unless you keep spending time on keeping on deleloping this feature.
  2. Jeff proposes using a profiler for debugging purposes
    • Not very helpful, as the profiler views (at least for now) are designed to help you analyze performance, not the call graph; does not work well, unless you spend a lot of time training yourself to getting used to the counter-productive user interface.

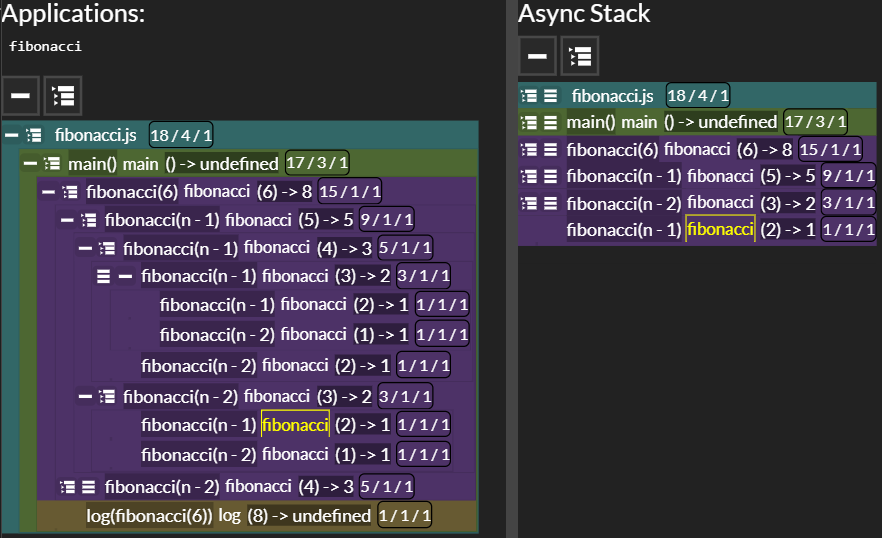
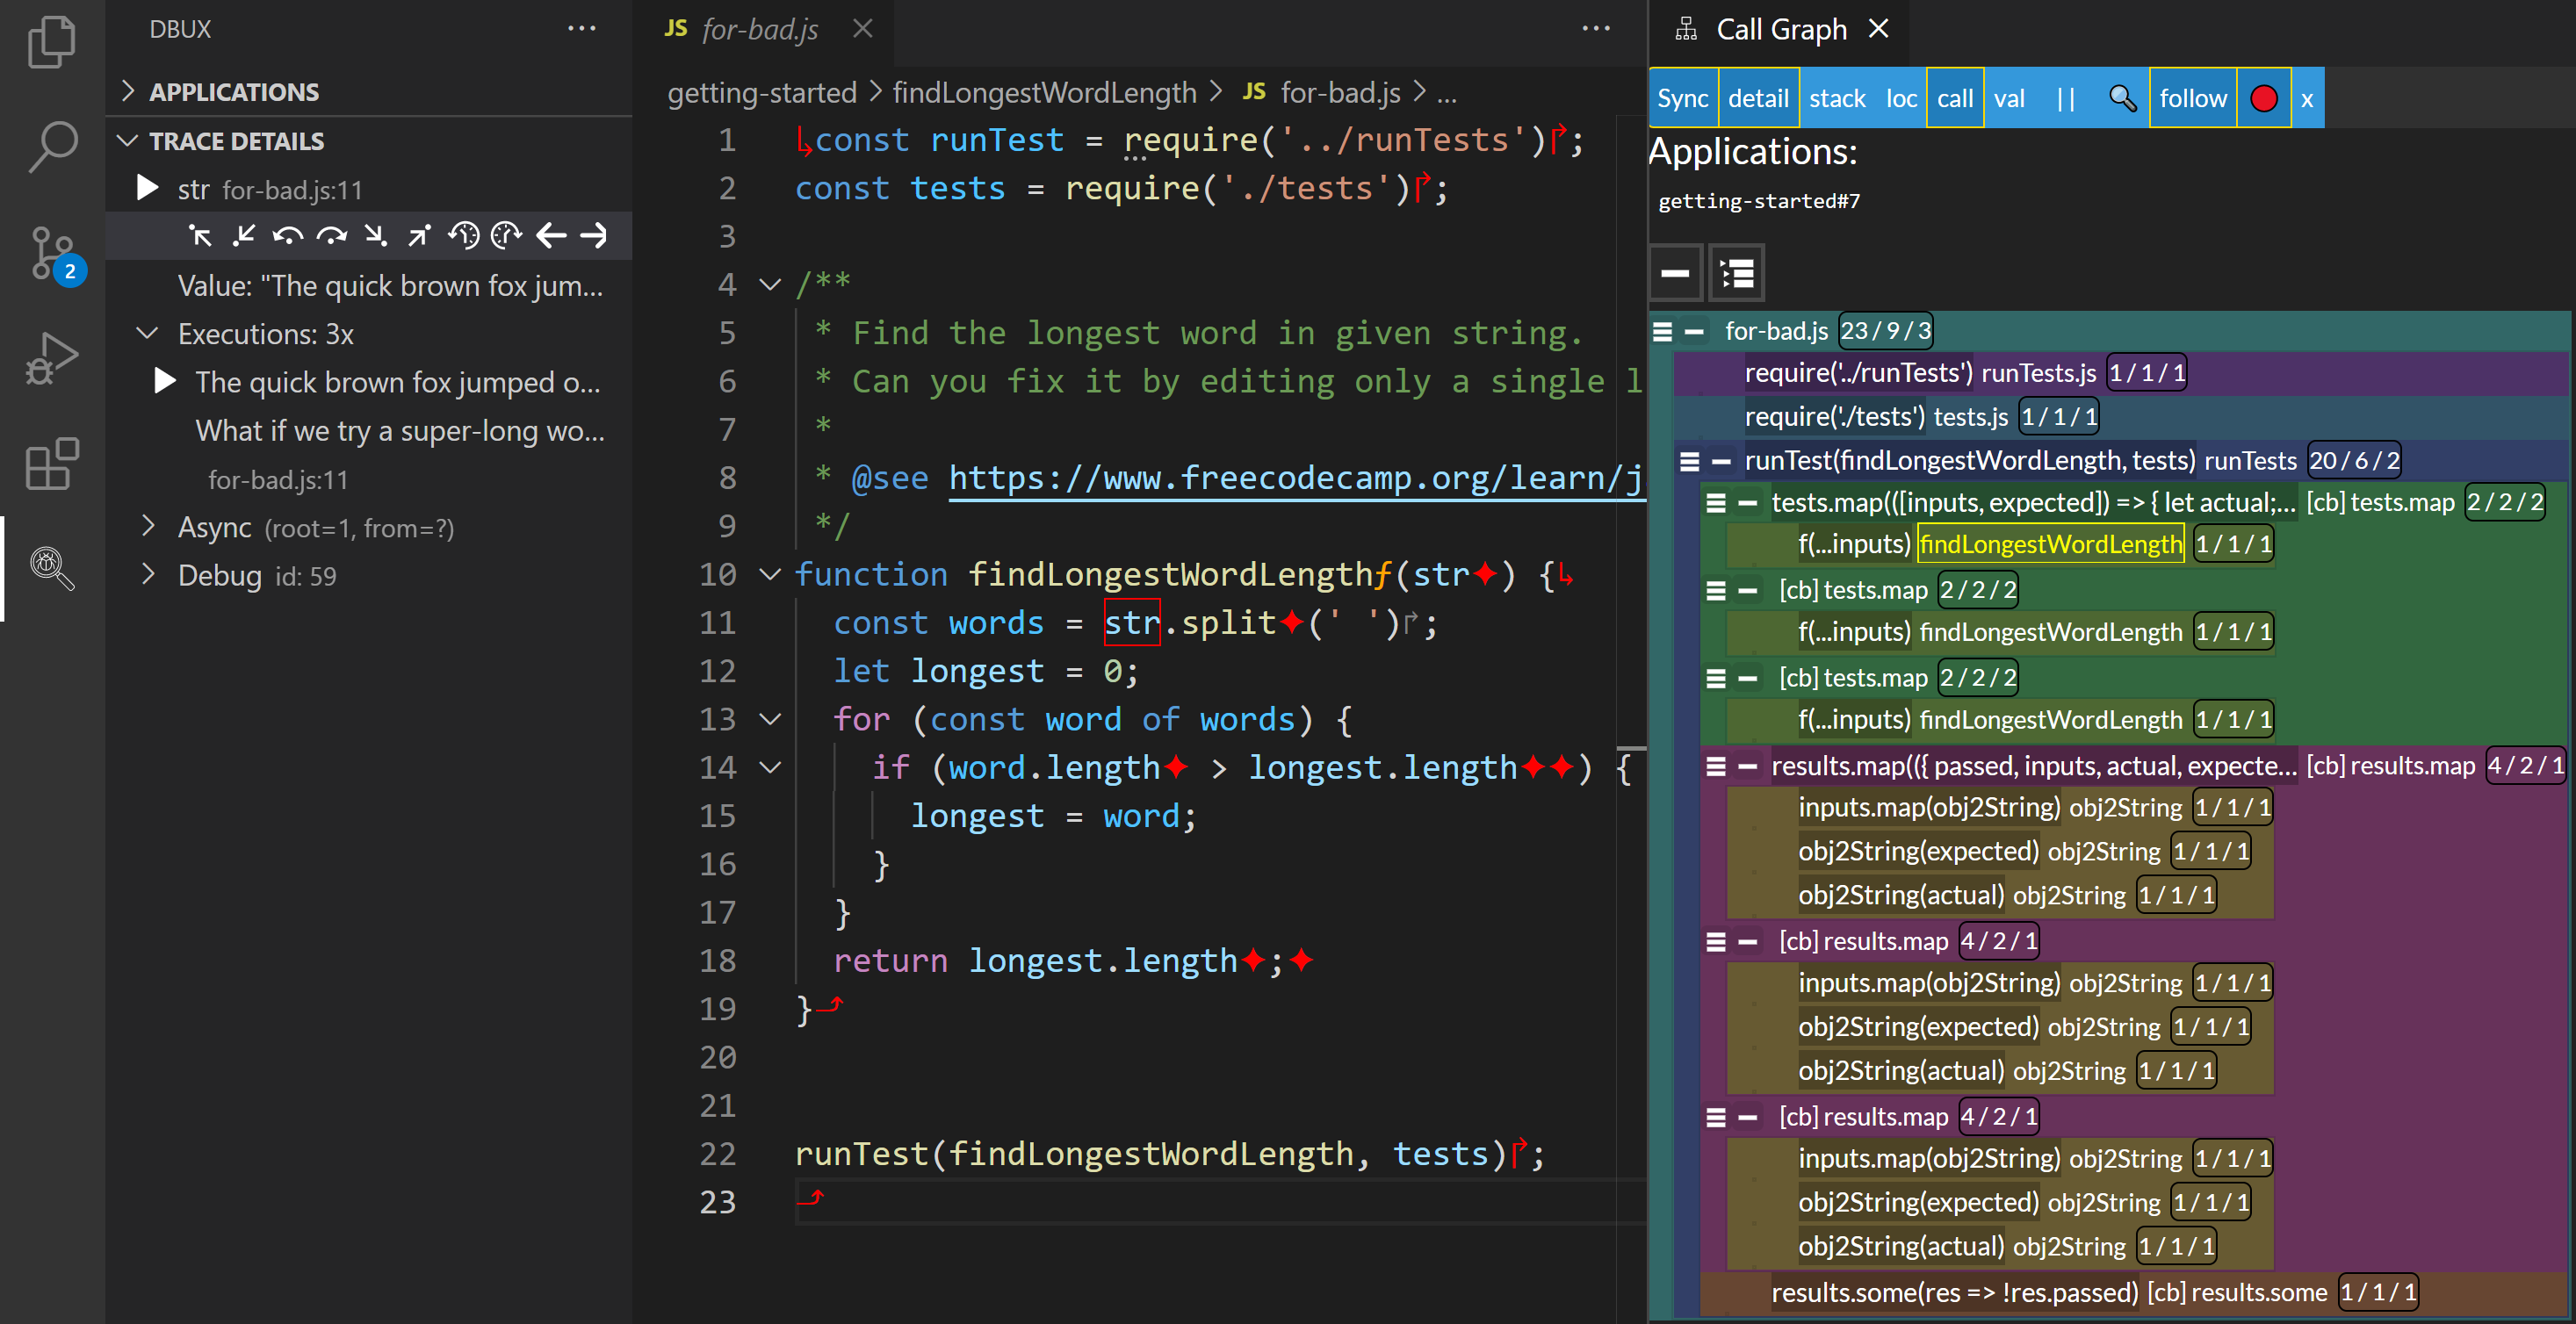
That is why I wrote Dbux - a VSCode extension that provides an omniscient debugger with dynamic execution analysis tools, code annotations and a full-blown dynamic call graph visualization tool, aimed at helping developers with Program Comprehension and Debugging.

Some examples -

Call Graph of a fibonacci(6):

Call Graph with code and other Dbux Tools in one screen:

Links:

You can trace function calls with help of putout code transformer. Plugin will look this way:

const {template, types, operator} = require('putout');
const {replaceWith} = operator;
const {BlockStatement} = types;

// create nodes
const buildLog = template(`console.log('TYPE' + ' ' + 'NAME')`);
const buildLogEnter = template(`console.log('enter' + ' ' + 'NAME' + '(' + JSON.stringify(Array.from(arguments)) + ')')`);
const buildLogException = template(`console.log('TYPE' + ' ' + 'NAME' + ': ' + trace$error.message); throw trace$error`);
const buildTryCatch = template(`try {
        BLOCK;
    } catch(trace$error) {
        CATCH;
    } finally {
        FINALLY;
    }
`);

const JSON = 'JSON';

// nodes we are searching for
module.exports.include = () => [
    'Function',
];

module.exports.fix = (path) => {
    const name = getName(path);
    
    // create 3 types of events
    const enterLog = buildLogEnter({
        NAME: name,
        JSON,
    });
    const exitLog = buildLogEvent(name, 'exit');
    const errorLog = buildLogExceptionEvent(name);
    
    // move function body into try-catch
    const bodyPath = path.get('body');
    replaceWith(bodyPath, BlockStatement([buildTryCatch({
        BLOCK: path.node.body.body,
        CATCH: errorLog,
        FINALLY: exitLog,
    })]));
    
    // add into the beginning of function "console.log" with "enter" event
    bodyPath.node.body.unshift(enterLog);
};


// get name of a function
function getName(path) {
    if (path.isClassMethod())
        return path.node.key.name;
    
    if (path.isFunctionDeclaration())
        return path.node.id.name;
    
    const {line} = path.node.loc.start;
    return `<anonymous:${line}>`;
}

// build logger
function buildLogEvent(name, type) {    
    return buildLog({
        NAME: name,
        TYPE: type,
    });
}

// build logger that throws
function buildLogExceptionEvent(name) {    
    return buildLogException({
        NAME: name,
        TYPE: 'error',
    });
}

Let's suppose that this is the code you want to trace:

const processFile = (a) => a;
process([]);

function process(runners) {
    const files = getFiles(runners);
    const linted = lintFiles(files);
    
    return linted;
}

function getFiles(runners) {
    const files = [];
    
    for (const run of runners) {
        files.push(...run());
    }
    
    return files;
}

function lintFiles(files) {
    const linted = [];
    
    for (const file of files) {
        linted.push(processFile(file));
    }
   
    return linted;
}

Here is a full picture:

enter image description here

If you save processed source as trace.js and run it with node, you will have:

> node trace.js
enter process([[]])
enter getFiles([[]])
exit getFiles
enter lintFiles([[]])
exit lintFiles
exit process

There is putout issue related to tracing functions.

Related