track C++ memory allocations

Viewed 50135

I am looking for a way to track memory allocations in a C++ program. I am not interested in memory leaks, which seem to be what most tools are trying to find, but rather creating a memory usage profile for the application. Ideal output would be either a big list of function names plus number of maximum allocated bytes over time or better yet, a graphical representation of the heap over time. Horizontal axis is time, vertical axis heap space. Every function would get it's own color and draw lines according to allocated heap bytes. Bonus points for identifying allocated object types as well.

The idea is to find memory bottlenecks/to visualize what functions/threads consume the most memory and should be targetted for further optimization.

I have briefly looked at Purify, BoundsChecker and AQTime but they don't seem to be what I'm after. Valgrind looks suitable, however, I'm on Windows. Memtrack looks promising, but requires significant changes to the source code.

My google skills must have failed me, cause it doesn't seem to be such an uncommon request? All the needed information to create a tool like that should be readily available from the program's debug symbols plus runtime API calls - no?

8 Answers

Use Valgrind and its tool Massif. Its example output (a part of it):

99.48% (20,000B) (heap allocation functions) malloc/new/new[], --alloc-fns, etc.
->49.74% (10,000B) 0x804841A: main (example.c:20)
| 
->39.79% (8,000B) 0x80483C2: g (example.c:5)
| ->19.90% (4,000B) 0x80483E2: f (example.c:11)
| | ->19.90% (4,000B) 0x8048431: main (example.c:23)
| |   
| ->19.90% (4,000B) 0x8048436: main (example.c:25)
|   
->09.95% (2,000B) 0x80483DA: f (example.c:10)
  ->09.95% (2,000B) 0x8048431: main (example.c:23)

So, you will get detailed information:

  • WHO allocated the memory (functions: g(), f(), and main() in above example); you also get complete backtrace leading to allocating function,
  • to WHICH data structure the memory did go (no data structures in above example),
  • WHEN it happened,
  • what PERCENTAGE of all allocated memory it is (g: 39.7%, f: 9.95%, main: 49.7%).

Here is Massif manual

You can track heap allocation as well as stack allocation (turned off by default).

PS. I just read that you're on Windows. I will leave the answer though, because it gives a picture of what you can get from a possible tool.

For a generic C++ memory tracker you will need to overload the following:

global operator new
global operator new []
global operator delete
global operator delete []
any class allocators
any in-place allocators

The tricky bit is getting useful information, the overloaded operators only have size information for allocators and memory pointers for deletes. One answer is to use macros. I know. Nasty. An example - place in a header which is included from all source files:

#undef new

void *operator new (size_t size, char *file, int line, char *function);
// other operators

#define new new (__FILE__, __LINE__, __FUNCTION__)

and create a source file with:

void *operator new (size_t size, char *file, int line, char *function)
{
  // add tracking code here...
  return malloc (size);
}

The above only works if you don't have any operator new defined at class scope. If you do have some at class scope, do:

#define NEW new (__FILE__, __LINE__, __FUNCTION__)

and replace 'new type' with 'NEW type', but that requires changing a lot of code potentially.

As it's a macro, removing the memory tracker is quite straightforward, the header becomes:

#if defined ENABLED_MEMORY_TRACKER
#undef new

void *operator new (size_t size, char *file, int line, char *function);
// other operators

#define NEW new (__FILE__, __LINE__, __FUNCTION__)
#else
#define NEW new
#endif

and the implementation file:

#if defined ENABLED_MEMORY_TRACKER
void *operator new (size_t size, char *file, int line, char *function)
{
  // add tracking code here...
  return malloc (size);
}
endif

Update: to the answer of @Skizz

Since C++20, we can use std::source_location instead of macros like __FILE__ and __LINE__.

(As this is a major simplification, I believe that it deserves a seperate answer).

On Mac OS X, you can use the code profiling tool Shark to do this, IIRC.

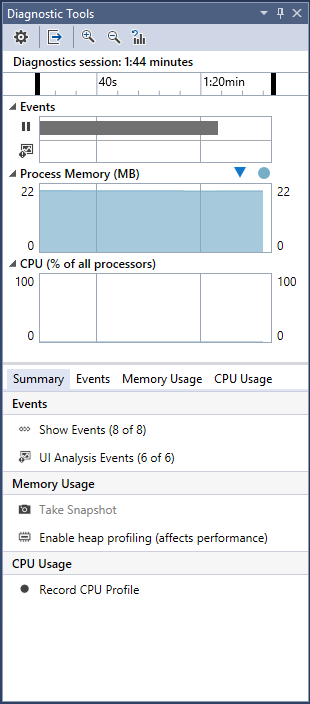
The Visual Studio IDE has built-in heap profiling support (since 2015), which is probably the easiest to start with. It has graphical views of heap usage over time, and can track allocations by function/method.

heap profiling

The CRT also has debug and profile support, which is more detailed and more low-level. You could track the data and plot the results using some other tool:

In particular, look at _CrtMemCheckpoint and related functions.

Related