
I grouped plots in indicator like this. It worked and grouped my plots as I wanted. But after that, lines become invisible. Please help me to fix this.
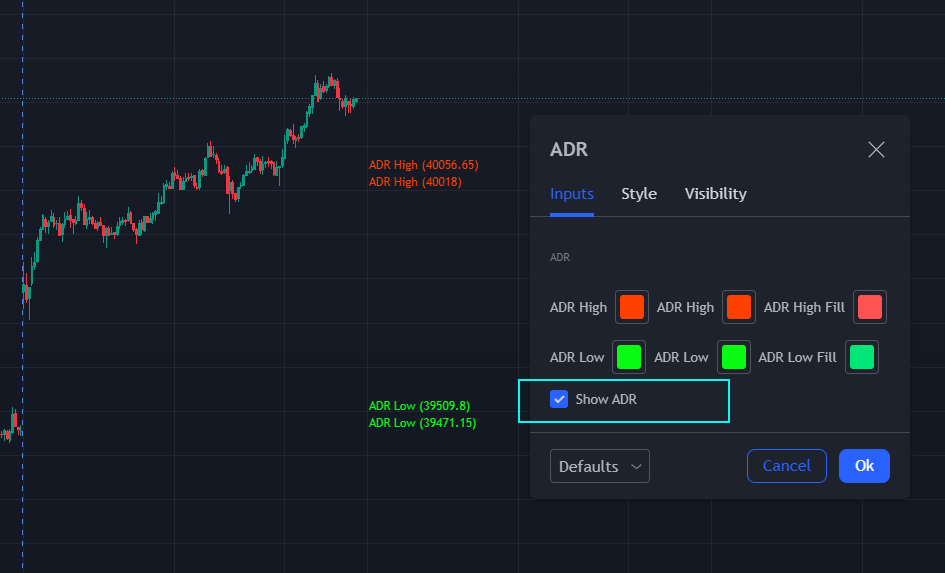
Here is the original script.
ADR1_high = plot(_adr1_high, title=text_ADR1_high, color=ta.change(_adr1_high) ? na : color_ADR1_high, style=plot.style_circles, linewidth=1)
ADR2_high = plot(_adr2_high, title=text_ADR2_high, color=ta.change(_adr2_high) ? na : color_ADR2_high, style=plot.style_circles, linewidth=1)
ADR1_low = plot(_adr1_low, title=text_ADR1_low, color=ta.change(_adr1_low) ? na : color_ADR1_low, style=plot.style_circles, linewidth=1)
ADR2_low = plot(_adr2_low, title=text_ADR2_low, color=ta.change(_adr2_low) ? na : color_ADR2_low, style=plot.style_circles, linewidth=1)
fill(ADR1_high, ADR2_high, title=text_upper_fill, color = ta.change(_adr1_high) ? na : color.new(adrUppercolorfill, 80))
fill(ADR1_low, ADR2_low, title=text_lower_fill, color = ta.change(_adr1_low) ? na : color.new(adrlowercolorfill, 80))
This is code I added and changed.
ADR = 1
showADRInput = input(true, "Show ADR", group='ADR')
ADR1_high = plot(_adr1_high ? ADR : na, title=text_ADR1_high, color=ta.change(_adr1_high) ? na : color_ADR1_high, style=plot.style_circles, linewidth=1)
ADR2_high = plot(_adr2_high ? ADR : na, title=text_ADR2_high, color=ta.change(_adr2_high) ? na : color_ADR2_high, style=plot.style_circles, linewidth=1)
ADR1_low = plot(_adr1_low ? ADR : na, title=text_ADR1_low, color=ta.change(_adr1_low) ? na : color_ADR1_low, style=plot.style_circles, linewidth=1)
ADR2_low = plot(_adr2_low ? ADR : na, title=text_ADR2_low, color=ta.change(_adr2_low) ? na : color_ADR2_low, style=plot.style_circles, linewidth=1)
fill(ADR1_high, ADR2_high, title=text_upper_fill, color = ta.change(_adr1_high) ? na : color.new(adrUppercolorfill, 80))
fill(ADR1_low, ADR2_low, title=text_lower_fill, color = ta.change(_adr1_low) ? na : color.new(adrlowercolorfill, 80))