
how do we add toogle option for enable or disable for fill in Input Tab like this?
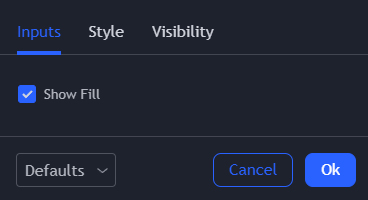
I tried to group the fill functions (line 131, 132) like this but it didn't work and giving error messages. I'm new at pinescript so I can't figure-out the errors. I didn't find the questions related the same matter. Can anyone help me with this?
Here is the code
// This source code is subject to the terms of the Mozilla Public License 2.0 at https://mozilla.org/MPL/2.0/
// © Serge_Trades
//@version=5
indicator(title='ADR', overlay=true)
text_ADR1_high = 'ADR High'
text_ADR2_high = 'ADR High'
text_ADR1_low = 'ADR Low '
text_ADR2_low = 'ADR Low '
text_upper_fill = 'ADR High Fill'
text_lower_fill = 'ADR Low Fill'
red = #FF4000
lime = #07fc13
//***Start of Inputs
var color_ADR1_high = input.color(defval=color.new(red ,0), title=text_ADR1_high, group='ADR', inline="Z1")
var color_ADR2_high = input.color(defval=color.new(red, 0), title=text_ADR2_high, group='ADR', inline="Z1")
var adrUppercolorfill = input.color(color.red, "ADR High Fill", tooltip="Color Zone between Two ADR High", group='ADR', inline="Z1")
var color_ADR1_low = input.color(defval=color.new(lime, 0), title=text_ADR1_low, group='ADR', inline="Z2")
var color_ADR2_low = input.color(defval=color.new(lime,0), title=text_ADR2_low, group='ADR', inline="Z2")
var adrlowercolorfill = input.color(color.lime, "ADR Low Fill", tooltip="Color Zone between Two ADR Low", group='ADR', inline="Z2")
var labels_enabled = true
plot_history = true
use_ema = false
adr_1 = 10
adr_2 = 5
//***End of Inputs
//***Start of local functions definiton***
draw_line(_x1, _y1, _x2, _y2, _xloc, _extend, _color, _style, _width) =>
dline = line.new(x1=_x1, y1=_y1, x2=_x2, y2=_y2, xloc=_xloc, extend=_extend, color=_color, style=_style, width=_width)
line.delete(dline[1])
draw_label(_x, _y, _text, _xloc, _yloc, _color, _style, _textcolor, _size, _textalign, _tooltip) =>
dlabel = label.new(x=_x, y=_y, text=_text, xloc=_xloc, yloc=_yloc, color=_color, style=_style, textcolor=_textcolor, size=_size, textalign=_textalign, tooltip=_tooltip)
label.delete(dlabel[1])
//If security is futures - replace the ticker with continuous contract
tickerid_func() =>
tickerid = syminfo.tickerid
if syminfo.type == 'futures'
tickerid := syminfo.root + '1!'
//Function to calculate ADR levels
//Parameters:
// * lengthInput - ADR period
// * hi_low - true-->High, else-->Low
adr_func(lengthInput,hi_low) =>
float result = 0
float adr = 0
open_ = request.security(tickerid_func(), "D", open, barmerge.gaps_off, barmerge.lookahead_on)
adr_High_sma = request.security(tickerid_func(), "D", ta.sma(high[1], lengthInput), barmerge.gaps_off, barmerge.lookahead_on)
adr_Low_sma = request.security(tickerid_func(), "D", ta.sma(low[1], lengthInput), barmerge.gaps_off, barmerge.lookahead_on)
adr_High_ema = request.security(tickerid_func(), "D", ta.ema(high[1], lengthInput), barmerge.gaps_off, barmerge.lookahead_on)
adr_Low_ema = request.security(tickerid_func(), "D", ta.ema(low[1], lengthInput), barmerge.gaps_off, barmerge.lookahead_on)
if use_ema
adr := adr_High_ema - adr_Low_ema
else
adr := adr_High_sma - adr_Low_sma
if hi_low//High
result := adr/2 + open_
else //Low
result := open_ - adr/2
//Workaround to disable color management on the standard tab Style for plots
//Custom inputs for colors should be used instead
transp_func() =>
transp_0 = 0
//***End of local functions definiton***
//***Start of getting data
start_time = request.security(tickerid_func(), "D", time_close[1],barmerge.gaps_off,barmerge.lookahead_on)
open__ = request.security(tickerid_func(), "D", open, barmerge.gaps_off, barmerge.lookahead_on)
adr1_high = adr_func(adr_1,true)
adr1_low = adr_func(adr_1,false)
adr2_high = adr_func(adr_2,true)
adr2_low = adr_func(adr_2,false)
//***End of getting data
float _adr1_high = na
float _adr1_low = na
float _adr2_high = na
float _adr2_low = na
float _open = na
//***Start of plotting*
//Decide if we can show the chart:
//Daily levels should be visible on intraday chart only
var show_chart = false
if timeframe.isintraday
show_chart := true
if show_chart == false
runtime.error("Change timeframe to intraday to see ADRx3 levels.")
//Plot all days
if show_chart and plot_history
_adr1_high := adr1_high
_adr1_low := adr1_low
_adr2_high := adr2_high
_adr2_low := adr2_low
_open := open__
ADR1_high = plot(_adr1_high, title=text_ADR1_high, color=ta.change(_adr1_high) ? na : color_ADR1_high, style=plot.style_circles, linewidth=1)
ADR2_high = plot(_adr2_high, title=text_ADR2_high, color=ta.change(_adr2_high) ? na : color_ADR2_high, style=plot.style_circles, linewidth=1)
ADR1_low = plot(_adr1_low, title=text_ADR1_low, color=ta.change(_adr1_low) ? na : color_ADR1_low, style=plot.style_circles, linewidth=1)
ADR2_low = plot(_adr2_low, title=text_ADR2_low, color=ta.change(_adr2_low) ? na : color_ADR2_low, style=plot.style_circles, linewidth=1)
fill(ADR1_high, ADR2_high, title=text_upper_fill, color = ta.change(_adr1_high) ? na : color.new(adrUppercolorfill, 80))
fill(ADR1_low, ADR2_low, title=text_lower_fill, color = ta.change(_adr1_low) ? na : color.new(adrlowercolorfill, 80))
//***End of plotting***
//***Start of Labels***
label_ADR1_high = ''
label_ADR2_high = ''
label_ADR1_low = ''
label_ADR2_low = ''
if labels_enabled == true
label_ADR1_high := str.tostring(math.round_to_mintick(adr1_high))
label_ADR2_high := str.tostring(math.round_to_mintick(adr2_high))
label_ADR1_low := str.tostring(math.round_to_mintick(adr1_low))
label_ADR2_low := str.tostring(math.round_to_mintick(adr2_low))
string_ADR1_high = ' (' + label_ADR1_high + ')'
string_ADR2_high = ' (' + label_ADR2_high + ')'
string_ADR1_low = ' (' + label_ADR1_low + ')'
string_ADR2_low = ' (' + label_ADR2_low + ')'
//Labels
if show_chart and labels_enabled == true
draw_label(bar_index, adr1_high, text_ADR1_high + string_ADR1_high, xloc.bar_index, yloc.price, color.new(color.white, 100), label.style_label_left, color.new(color_ADR1_high,transp_func()), size.normal, text.align_left, '')
draw_label(bar_index, adr2_high, text_ADR2_high + string_ADR2_high, xloc.bar_index, yloc.price, color.new(color.white, 100), label.style_label_left, color.new(color_ADR2_high,transp_func()), size.normal, text.align_left, '')
draw_label(bar_index, adr1_low, text_ADR1_low + string_ADR1_low, xloc.bar_index, yloc.price, color.new(color.white, 100), label.style_label_left, color.new(color_ADR1_low,transp_func()), size.normal, text.align_left, '')
draw_label(bar_index, adr2_low, text_ADR2_low + string_ADR2_low, xloc.bar_index, yloc.price, color.new(color.white, 100), label.style_label_left, color.new(color_ADR2_low,transp_func()), size.normal, text.align_left, '')
///////////////////////////////////////////////////////////////